Half way through the NBA season, we can be pretty sure that the Chicago Bulls are a slightly below average team. They sit in the 9th spot of the weak Eastern Conference and are getting outscored by 4.7 points per game, which is 4th worst in basketball. The offense has been the weak point this season, averaging 92.7 points per game, only better than the 91.6 of the injury plagued Detroit Pistons.
Lets quickly figure out the source of the scoring differential between the Bulls and their opponents. In simplest terms, the offense tries to score points and the defense tries to prevent them. Hence the point differential. I recently described that there are only 3 ways to score in the NBA, so which of these 3 is the source of the Bulls struggles.
1) Take more shots than your opponents, or shoot a higher percentage to make more shots. The Bulls are being out-shot by less than 1 attempt per game, which is minimal, and are shooting 1% less from the field than their opponents, which only equates to 1 extra shot made per 100 attempts. Neither of these are significant enough to make up a 4.7 point differential.
2) Make more 3 point shots as they are worth 50% more than a regular field goal. The difference in the 3-pt field goal percentage is 0.1% between the Bulls and their opponents. Thats 1 extra made every thousand chances. Completely irrelevant. However, the opponents have made 251 out of 750 attempts, while the Bulls have made just 129 out of 386 attempts. Thats 122 more trifectas over the course of 35 games. Thats appoximately 3.5 more 3-pointers per game, equaling an extra 3.5 points for the opposition. Obviously, the Bulls miss those 2.1 3-pointers Ben Gordon averaged last year. Also, they shot and unrealistically high 38% from the arc last year, which has regressed back to a respectable 33% this year. Their lack of a 3-point shooter may be the difference between getting into the playoffs and not.
3) Take more free throw attempts per game, which will lead to more "free points". The Bulls have been out-shot by only 21 free throws this season, just over half a free throw per game. This figure is insignificant in the big picture.
Hopefully it is now clear that the main macroscopic issue of the Bulls offense this season is the 3-point shot. I would recommend that instead of that stupid 20 footer Loul Deng loves to take, he should take a step back and throw up some 3's. Same risk, 50% more reward.
Showing posts with label Statistics. Show all posts
Showing posts with label Statistics. Show all posts
Is walking in baseball an old man's skill? (part 2)
As I showed in part one, there was a pretty strong correlation between walking and age last season (R-Squared was .587). I took the idea from part one (is walking an old man's skill?) and took it a step further. According to Fangraphs, there have been 3,636 players in the history of baseball who have accumulated 1000+ PAs. Over the past several weeks, largely because I did not know that there already existed an excel function (pivot table) to do it for me, I organized and sorted every one of those 3,636 players by BB% and took the average PA (and wOBA, for good measure) by walk rate (categorizing each walk rate by 1/10 of a percent). From there, I graphed the data and calculated the correlations. The lowest walk rate in the sample size (0.40%) belonged to a man by the name of George Zettlein (1108 PAs, .209 wOBA). The highest walk rate in the sample size (20.80%) belonged not to Barry Bonds (20.60%), but Ted Williams (9791 PAs, .493 wOBA).
The basis questions to the two data sets was as follows:
1) Do players who walk more get more PAs (in other words, do players who walk more have longer careers)?
2) Are players who walk more generally better at baseball (is BB% correlated to wOBA)?*
*note: wOBA is an OPS-like metric, which is skewed towards OBP rather than SLG and accounts for other factors such as SB%.
Chart #1 (click to enlarge): BB% (x-variable) to PAs (y-variable)

The R-Squared for this data set is .551
Chart #2 (click to enlarge): BB% (x-variable) to wOBA (y-variable)

The R-Squared for this data set is .639 (no surprise).
Other tidbits of data:
-The average wOBA over this sample size was .321
-The average BB% of the 3,636 players was 8.21%
-The average PA/career in the data set was 3596.
Conclusions:
-No surprise here, but the backbone of production is walking. There is a very high (approx. +.64) correlation.
-Walking is an old man's skill. There is a strong coefficient of determination between how many PAs a player will get over the course of his career and his walk rate. I feel that the strength of the coefficient is understated by two factors. First, guys like Albert Pujols are still young. In other words, a lot of very good players are still very young and haven't gotten the chance to accumulate 6000+ PAs yet. Secondly, and more importantly, many players with great talent are derailed by injury. There are plenty of players with fantastic peripherals who just cannot stay healthy and thus get fewer PAs across their career, thus distorting the lower ends of the data. When calculating the average PAs for players with better walk rates within the data (13+%), I noticed many players whose careers ended before accumulating even 2500 PAs.
This data should be pretty reliable. The minimum sample sizes necessary to draw statistically relevant inferences from the data is 200 PA for BB% and 500 PA for OPS. wOBA is somewhat related to OPS (though a much better representation of a player's offensive value), thus I make the logical, but mathematically unproven assumption that 1000 PAs would be a good minimum range for the data from which I could draw statistically relevant conclusions about wOBA (in relation to BB%).
All in all, the answer seems to be yes, walking is an old man's sport.


Stupid Statistics
I love statistics, but I have come across a few instances where subjectivity plays to big of a factor into certain stats.
Stat #1
The Bears rank 14th this year in pass blocking on the O-Line according to footballoutsiders.com
What!? This can not be right. This offense line is fucking garbage! I think that because Jay is able to get the ball off in time and gets tackled after he throws the ball that the offensive line doesn't charged with the shit it should
Stat #2
There is a stat on pro-football reference called "Big Games"
Here's what defines a big game 300 yards passing, 100 yards rushing or receiving, or 4 TDs- what arbitrary shit is this!?
Hispanic players swim don't walk
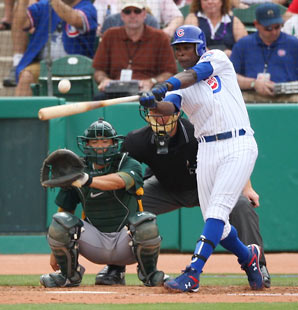
We have all heard the baseball cliche, "you can't walk your way off the island, but you can swing". This obviously refers to hispanic baseball players' propensity to be free swingers. The names Soriano, Guerrero, and Pudge come to mind as players to whom the regular strike zone does not apply. I wanted to do a crude analysis to determine the validity of this statement; however, being a medical student with no time to breath, this will be a very crude examination. Instead of breaking down the entire league into ethnic groups groups and finding significant variations, I will instead just look at the composition of extreme values within statistics I deem important to the topic.
Firstly, I looked at the top and bottom 20 players in terms of walk percentage with a minimum of 350AB. That represents a respectable 3-4 months of baseball and a good way to weave out bench players.
In 2009, 16 of the 20 lowest walk rates belong to latin american born players ranging from Bengie Molina 2.8% to Vlad Guerrero 4.8%. In 2008, 14 of bottom 20 were hispanic. And in 2007, 9 of bottom 20 were latin. The field in 2oo7 was constituted by really bad/old players who slightly disrupted the trend. They included Barfield, John McDonald, Jay Payton, Corey Patterson, and Craig Biggio.
Sorting by highest walk rates, 2009 featured 6 of top 20 being hispanic. However, this included several players who were born in the United States like Arod and Carlos Pena. 2008, 5 of top 20. And 2007 featured 3 of the top 20 walk rates.
Second, I looked at what fangraphs describes as swinging at pitches outside of the strike zone(0-swing%). 12 of top 20 swing percentages in 2009. 10 of top 20 in 2008. 12 of top 20 in 2007.
Lowest O-swing% break down: Only 3 of the top 20 in this list included hispanic players each of the last 3 years. It should be noted that Bobby Abreu and Luis Castillo were in the top 20 each all 3 years with Castillo leading baseball every year.
Considering the ethnic breakdown of the current state of major league baseball: 60% White, 30% Hispanic, 8% Black, and 2% Asian, the trends at the extreme values of walk rate and plate discipline appear to confirm the propensity of Latin American born players to "swing" their way off the island. To rephrase an old Chris Rock joke about african americans, "we're 10% of the population, yet we're 90% of the final 4". The same applies to baseball, "Hispanics are 30% of the baseball population, yet they're 80% of the if you see it you can hit it club"
How Do You Measure A Wide Receiver?
This is a question I posed back in December when I was trying to determine greatness for individual positions to see who DESERVES to go to the pro bowl. You can absolutely judge and quantify a wide receiver (much more so than say a safety) and there are many numbers you can look at. But sort of similar to baseball, there are a lot of numbers out there to look at and not all of them are per se helpful (at least not individually).
Normally, I would would go to football sabermetrics to determine this answer. However, for wide receivers this does not help so much. There are two main statistical categories that are normally good: DVOA and DYAR. According to footballoutsiders.com:
Last year Andre Johnson was #1 in DYAR, yet Devery Henderson of the Saints was #1 in DVOA. I don't think even Henderson's mom would think her son is better than Andre Johnson. Last year, the top five wide outs in terms of DYAR were:
1) Andre Johnson (Texans)
2) Larry Fitzgerald (Cardinals)
3) Roddy White (Falcons)
4) Vincent Jackson (Chargers)
5) Steve Smith (Panthers)
Pretty elite list, no? Now let's take a look at top wide outs by DVOA
1) Devery Henderson (Saints)
2) Vincent Jackson (Chargers)
3) Anthony Gonzalez (Colts)
4) Steve Smith (Panthers)
5) Roddy White (Falcons)
At first glance, you would probably say that DYAR is the better metric for judging wide outs, especially considering the names consistently, year after year, atop of DYAR lists versus those a top the DVOA.
But wait a minute, that's not quite fair to those on the DVOA list; the main reason the guys on the DVOA list don't really top the DYAR list is because they don't get thrown to. Using that logic, Craig Biggio is a guaranteed Hall of Famer just because he got so many ABs that he was able to join the 3,000 hits club. Andre Johnson caught as many passes (115) than Henderson had balls throw to him (56). If Henderson had had 171 passes thrown his way like Johnson did, he would have easily have been the best receivers last year. In fact, here's what Henderson's numbers would have been if that had happened:
Here's what Andre Johnson did do:
The reason Henderson's numbers looked so good and the reason he was #1 in DVOA, because he had a league best 24.8 Yards Per Reception. Judging wide outs using a baseball sabermetric mind, we WOULD say that Devery Henderson was better than Andre Johnson, just Johnson had more passes thrown his way (ABs). But the problem, is that judging a wide out by his average is not really the way to go. It's perfect for a RB, but not so much for a wide receiver. Take this scenario:
Player A: 10 catches, 100 yards, 1 TD, 10 YPR
Player B: 2 catches, 100 yards, 1 TD, 50 YPR
By average terms, we would say that Player B was better because he was able to do more with less and his five times greater yards per reception. But I don't believe that true in real life. I would actually argue that Player A was better because he (probably) got more first downs for his team and was consistently available throughout the entire game, versus Player B, who probably just one amazing play. Both look good for fantasy football, but I would say Player A was better in the real game. So while a wide out like Andre Johnson may get more passes and catches, that actually does make him better! Receptions are analogous to ABs in baseball, but in baseball, you don't FORCE ABs, their automatic. Not true in football. A wide receiver had to FORCE himself to get open and the consistently make catches.
That, I believe, leads a nice transition into my last metric to judge a wide out: catch rate. Here's how footballoutsiders.com defines catch rate:
Unfortunately catch rate is not perfect yet, but it's pretty damn close. It essentially states that how well does a receiver do when the ball is thrown to him. It doesn't account for how many passes a receiver was thrown, just individually, how well does a player do when the ball is throw the receiver's way. And isn't that really what a wide out's job is: to catch passes thrown his way. Last year, there were only ten receivers who topped 70% in catch rate with a minimum of 50 passes thrown his way:
1) Ike Hillard (Bucs): 81%
2) Wes Welker (Patriots): 75%
3) Greg Jennings (Packers): 72%
3) Devone Bess (Dolphins): 72%
3) Anthony Gonzolaz (Colts): 72%
6) Anquan Boldin (Cardinals): 71%
6) Antonio Bryant (Bucs): 71%
6) Josh Reed (Bills): 71%
6) Eddie Royal (Broncos): 71%
10) Steve Smith (Giants): 70%
Sure, this list doesn't look at flashy or "good" as the DYAR list, but I think this is the better metric than both DYAR and DVOA. Sure, the vast majority of this list consists of guys that you don't think are "good", but that's because they don't get thrown to a lot. Sure, you can make the argument that because these guys weren't good they couldn't get open and thus the limited time they did get open they were able to catch what was thrown. But the fact that these guys couldn't get open makes them not good. And I don't know about that. It could be true, but I think that logic understates just how well these guys did when their number was called.
So back to our original question: how do you measure a wide receiver? Well I don't think you can use just one measure. I think it's just fine to look at the "traditional" and fantasy football numbers just fine. Despite what I wrote in this article, you'd be hard pressed to say that Devery Henderson and Ike Hillard are better than Andre Johnson, Larry Fitzgerald, and Randy Moss. Those guys put up a ton of yards and TDs. Sure they may not get it as efficiently as guys like Henderson or Anthony Gonzalez, but they sure as hell produce.
But that's not to say you shouldn't look beneath the surface either. Looking at DVOA, DYAR, and catch rate is extremely useful. But I think for wide receivers, it's mainly a secondary source to the primary of catches, yards, and TDs.
Normally, I would would go to football sabermetrics to determine this answer. However, for wide receivers this does not help so much. There are two main statistical categories that are normally good: DVOA and DYAR. According to footballoutsiders.com:
The simple version: DYAR means a wide receiver with more total value. DVOA means a wide receiver with more value per play.
Last year Andre Johnson was #1 in DYAR, yet Devery Henderson of the Saints was #1 in DVOA. I don't think even Henderson's mom would think her son is better than Andre Johnson. Last year, the top five wide outs in terms of DYAR were:
1) Andre Johnson (Texans)
2) Larry Fitzgerald (Cardinals)
3) Roddy White (Falcons)
4) Vincent Jackson (Chargers)
5) Steve Smith (Panthers)
Pretty elite list, no? Now let's take a look at top wide outs by DVOA
1) Devery Henderson (Saints)
2) Vincent Jackson (Chargers)
3) Anthony Gonzalez (Colts)
4) Steve Smith (Panthers)
5) Roddy White (Falcons)
At first glance, you would probably say that DYAR is the better metric for judging wide outs, especially considering the names consistently, year after year, atop of DYAR lists versus those a top the DVOA.
But wait a minute, that's not quite fair to those on the DVOA list; the main reason the guys on the DVOA list don't really top the DYAR list is because they don't get thrown to. Using that logic, Craig Biggio is a guaranteed Hall of Famer just because he got so many ABs that he was able to join the 3,000 hits club. Andre Johnson caught as many passes (115) than Henderson had balls throw to him (56). If Henderson had had 171 passes thrown his way like Johnson did, he would have easily have been the best receivers last year. In fact, here's what Henderson's numbers would have been if that had happened:
171 passes, 97 receptions, 2,417 yards, 9 TDs, 24.8 YPR
Here's what Andre Johnson did do:
171 passes, 115 receptions, 1,575 yards, 8 TDs, 13.1 YPR
The reason Henderson's numbers looked so good and the reason he was #1 in DVOA, because he had a league best 24.8 Yards Per Reception. Judging wide outs using a baseball sabermetric mind, we WOULD say that Devery Henderson was better than Andre Johnson, just Johnson had more passes thrown his way (ABs). But the problem, is that judging a wide out by his average is not really the way to go. It's perfect for a RB, but not so much for a wide receiver. Take this scenario:
Player A: 10 catches, 100 yards, 1 TD, 10 YPR
Player B: 2 catches, 100 yards, 1 TD, 50 YPR
By average terms, we would say that Player B was better because he was able to do more with less and his five times greater yards per reception. But I don't believe that true in real life. I would actually argue that Player A was better because he (probably) got more first downs for his team and was consistently available throughout the entire game, versus Player B, who probably just one amazing play. Both look good for fantasy football, but I would say Player A was better in the real game. So while a wide out like Andre Johnson may get more passes and catches, that actually does make him better! Receptions are analogous to ABs in baseball, but in baseball, you don't FORCE ABs, their automatic. Not true in football. A wide receiver had to FORCE himself to get open and the consistently make catches.
That, I believe, leads a nice transition into my last metric to judge a wide out: catch rate. Here's how footballoutsiders.com defines catch rate:
Catch Rate represents the percentage of passes to this receiver completed. This is a reference to incomplete passes, not dropped passes: dropped passes are not specified in publicly available play-by-play, and unfortunately we cannot yet correct for this.
Unfortunately catch rate is not perfect yet, but it's pretty damn close. It essentially states that how well does a receiver do when the ball is thrown to him. It doesn't account for how many passes a receiver was thrown, just individually, how well does a player do when the ball is throw the receiver's way. And isn't that really what a wide out's job is: to catch passes thrown his way. Last year, there were only ten receivers who topped 70% in catch rate with a minimum of 50 passes thrown his way:
1) Ike Hillard (Bucs): 81%
2) Wes Welker (Patriots): 75%
3) Greg Jennings (Packers): 72%
3) Devone Bess (Dolphins): 72%
3) Anthony Gonzolaz (Colts): 72%
6) Anquan Boldin (Cardinals): 71%
6) Antonio Bryant (Bucs): 71%
6) Josh Reed (Bills): 71%
6) Eddie Royal (Broncos): 71%
10) Steve Smith (Giants): 70%
Sure, this list doesn't look at flashy or "good" as the DYAR list, but I think this is the better metric than both DYAR and DVOA. Sure, the vast majority of this list consists of guys that you don't think are "good", but that's because they don't get thrown to a lot. Sure, you can make the argument that because these guys weren't good they couldn't get open and thus the limited time they did get open they were able to catch what was thrown. But the fact that these guys couldn't get open makes them not good. And I don't know about that. It could be true, but I think that logic understates just how well these guys did when their number was called.
So back to our original question: how do you measure a wide receiver? Well I don't think you can use just one measure. I think it's just fine to look at the "traditional" and fantasy football numbers just fine. Despite what I wrote in this article, you'd be hard pressed to say that Devery Henderson and Ike Hillard are better than Andre Johnson, Larry Fitzgerald, and Randy Moss. Those guys put up a ton of yards and TDs. Sure they may not get it as efficiently as guys like Henderson or Anthony Gonzalez, but they sure as hell produce.
But that's not to say you shouldn't look beneath the surface either. Looking at DVOA, DYAR, and catch rate is extremely useful. But I think for wide receivers, it's mainly a secondary source to the primary of catches, yards, and TDs.
Why Looking At Traditional Stats Can Be a Good Thing
Obligatory pause for TBO and DME to get calm down from their frustration
What I'd like to talk about today is just how far this site looks at sabermetric statistics and peripherals and just how much we miss the big picture and the usefulness of traditional stats. Now I am of course guilty of this as well. I have looked at Fangraphs so much over the past few weeks I didn't know the actual MLB leaders right now. I could tell you who I think is GOING to do well, but not who is. I have been looking at Fangraphs so much that it was a HUGE shock to me just how well Joel Pinero is doing right now. I think that it can not last and he will soon blow up and suck, but let's not take for granted that him and others like him have still put up some decent numbers.
What I'd like to talk about today is just how far this site looks at sabermetric statistics and peripherals and just how much we miss the big picture and the usefulness of traditional stats. Now I am of course guilty of this as well. I have looked at Fangraphs so much over the past few weeks I didn't know the actual MLB leaders right now. I could tell you who I think is GOING to do well, but not who is. I have been looking at Fangraphs so much that it was a HUGE shock to me just how well Joel Pinero is doing right now. I think that it can not last and he will soon blow up and suck, but let's not take for granted that him and others like him have still put up some decent numbers.
The ten main traditional stats are the ones used by major 5x5 fantasy leagues: W, ERA, WHIP, SV, K, BA, SB, HR, RBI, and R. Now individually, all these stats are pretty bad indicators of how good a player is. In 2005, Justin Morneu won the AL MVP solely on RBI's which was pretty lame, but that doesn't mean RBI and the other 9 traditional stats are completely useless either
RBI: We get so caught up in all these statistics that we forget the basic goal of the game of baseball- to face a pitcher in order for a player to round the bases or the prevent players from doing so. And at its core, if a player gets an RBI, he's helping his team win the fundamental game of baseball. Now we are know that great players can have mediocre RBI totals (Pujols) and that not the best can have phenomenal RBI totals (last year Josh Hamilton). But BA of RISP isn't necessarily a bad statistic. If guys are on base, you need to make contact in order to bring those runners home. BA RISP is very close to RBIs and we think that's a decent indicator right? OBP has a causal effect with scoring runs and a guy like Adam Dunn can still get a shit ton of RBIs despite his lack of contact because of his power. Also, I would be very happy with RBI being eliminated altogether. But I don't know, it and its essence can be useful.
BA: As mentioned earlier and something everyone who argues baseball needs to know the great importance of OBP, but BA CAN still be useful. Prime example- 2008 Nick Swisher (also Ryan Howard). Last year both has great walk rates and plate discipline. But both had pretty bad OBP that were frankly unacceptable and this was caused by their poor BA. Also, I don't care if a player hits .200 or .375, a .400 OBP is a .400 OBP no matter. So if you're a guy who can't really walk that well, it's OK to hit the ball a lot because that still helps your team. Obviously, a guy who walks in more prone to stabilizing a .400 OBP versus the .375 BA hitter, but if in 162 games you still maintain a high OBP despite low walks, more power to you.
SB: High SB can suck (Scotty Pods) but high stolen bases while rarely getting caught (Carl Crawford this year), EXTREMELY helpful to your team. Yes, SB alone needs to be taken with a grain of salt, but stealing a lot can be very beneficial to a ball club
HR: Probably the only great (or even pretty good) traditional stat. A HR is a HR, no mater what and a lot of them help your team
W: As Dan Haren has shown this year and as many pitchers have shown throughout the game of baseball, you can pitch just a fantastic game and get the L. But over time, if you generate a shit ton of W, you're pretty good. Just like QB rating in football, just because you're #1 in this category doesn't mean you're the greatest, but you sure belong in the discussion. Look at all the guys who have 300+ wins, all HOF worthy players right (I guess DME can find me one who isn't HOF worthy but that's besides the point). In one game you get the W- probably meaningless. Over the course of time you get W- pretty good
ERA: As The Hidden Game of Baseball overtly mentions, ERA can be so subjective with unearned runs and such. Hell, yesterday, Bartolo Colon only got ONE earned run even though he let in 8. And we look at FIP so much and that we almost discount ERA altogether. However, we almost forget just how useful ERA can be. If you consistently have a low ERA, you're probably a pretty good pitcher. I think minor changes should and have been made to ERA and what really constitutes an earned run and how much defense if blamed by the defense and not the pitcher and all that junk is what makes ERA so problematic, but can be extremely useless. I think we tend to overlook ERA a lot when he delve deeper into peripherals. I mean, why do we look at WHIP and FIP and such for the most part, to see if a pitchers ERA can stabilize, right?
K: Obviously if a player can generate a shit ton of SO, they are pretty good. But a player can be great without striking out a lot of guys (Buerhle) and a player can strike out a ton of guys and suck (Parra). This tends to tell me that K aren't THAT useful as people hype them up to be. In my heart of hearts I want all my players to strike out a ton of guys every outing and as DME has said: Ks have a causal relationship with run prevention. I think this stat is very similar to HRs in that it is widely used and many people use it as an indicator for greatness. In this stat though, I'm going to go the other way and say, as a whole, yes, it can and should be used as a measure, let's take K along with K/9, BB/9 and other stats as well.
SV: As Moneyball has shown us, saves really just inflate the value of a pitcher and I think with the signing of K-Rod and other closers this year, teams are finally realizing saves are overrated. The odds of losing a 3 run in an inning is extremely low and a lot of pitchers can get saves. But 1) I think SV can be like W, one is meaningless but a shit ton is awesome and 2) there are many save situations (like holding a one run lead) ARE extremely useful. While a lot of pitchers (especially those on the Halos staff) could have saved 60+ games like K-Rod did, we still should give the man some props for saving as many one run games as he did. Also, SV should be used like SB, look at a players net value, not outright value. Also, personally, I like saves despite common knowledge and logic.
Now let me get this clear (please read this carefully DME) 1) I am not arguing for traditional stats. I love sabermetric stats, but I think we completely absolutely overlook traditional stats and I think we need to at least keep an eye on them 2) Please look at my broad themes and not my specific examples. I don't need some long winded post about how good Manny Parra is or anything or the sort. If you do, you absolutely missed the point of what I'm trying to say. I think sometimes we look so deep into sabermetrics and Fangraphs and whatnot that we forget the broad landscape and all I'm trying to do is make you see that. And while I have sort of sent conflicting messages, all I'm saying is that sometimes it's OK to look on ESPN's MLB stats page and see how players are doing RIGHT NOW.
The Great Runs Expectancy Chart
Here is a chart of the mathematical run expectancy (based on tons of data from 1999 through 2002) with various runners on or not on various bases with various amounts of outs. Cool shit, right? It sort of proves that sac bunting a guy over from any base decreases run expectancy. Take that, Dusty Baker!


Applying Statistics to Actors
In a recent ESPN.com post, Bill Simmons talks about statistics in relating to the best actors and actresses of all time. Since, as our mission statement says, "Statistics are our science and 'the immeasurable character of men' is the obsolete religion of blind faith" and since we love movies as well, I figure this article would be an interesting, light-hearted read. Here's an excerpt:
You can read the whole column here
If the Oscars were reliable, they would help us create a formula that enabled us to rank actors of all eras. Well, what if we tried anyway? Let's make best actor/actress nods worth seven points and nominations worth three. Then let's make best supporting actor/actress nods worth three and nominations worth one. It's a highly scientific formula I just spent at least 27 seconds devising. And guess what? The Simmons Cinematic System shakes out in an overwhelmingly logical way.
VODM: VALUE OVER DERMOT MULRONEY, NOT VALUE OVER REPLACEMENT PLAYER.
Top 13 actors: Nicholson (38); Spencer Tracy (35); Laurence Olivier (32); Marlon Brando (30); Hoffman, Newman (29); Jack Lemmon (28); Peter O'Toole (24); Gary Cooper, Hanks, Penn (23); De Niro and Pacino (22).
Top 10 actresses: Hepburn (52); Streep (45); Bette Davis (41); Ingrid Bergman (29); Jane Fonda (27); Greer Garson (25); Liz Taylor (23); Jessica Lange, Sissy Spacek (22); Ellen Burstyn (20).
Other moderns of note: Daniel Day-Lewis, Foster and Kate Winslet (18); Robert Duvall (16); Russell Crowe, (13); Sly Stallone (3); Keanu Reeves (0).
Are you happy with those rankings? Me too! I'm a genius! Yeah, Pacino and De Niro should be higher, but they were robbed in '74 and '76, so their stats make sense. Lemmon's number surprises me a little. Same for Fonda. Other than that, I have no major qualms besides a failure to account for iconic performances like De Niro's in Raging Bull (should it be worth 10?), Nicholson's in The Shining (he wasn't even nominated!) and Keanu's in Point Break ("I am an EFF BEE EYE AGENT!").
Now, if you feel like getting your supernerd on, you could figure out Simmons Points on a per-film basis by dividing SPs by movies made (Streep has a sterling 1.13 average), a Hollinger-like AER (actor's efficiency rating, some combination of awards and box office gross that would invariably crown Harrison Ford the greatest ever and drive me crazy) or even VODM (like baseball's value over replacement player, only it would be value over Dermot Mulroney). Just make sure you run all of your calculations through me, because I just bought the URL www.hollywoodprospectus.com.
You can read the whole column here