A couple of years ago, former THT writer Dan Turkenkopf tabulated an index of single-season (2009) and four-year home run per fly ball (HR/FB) park factors. I have griped plenty about using HR/FB rates over home run per outfield fly ball (HR/OFFB) rates in tabulating xFIP many times in the past, most recently last week, because HR/FB rates include pop-ups (IFFB), which can never be home runs. The data, over large samples, may be insignificant in difference overall, but why use bad data and skew the margins? It's like Fangraphs' incomprehensible decision to use strikeouts per at-bat (K/AB) instead of strikeouts per plate appearance (K/PA) to calculate strikeout percentage*. (Dave Cameron has indicated that recalibrating Fangraphs' database would likely be a cumbersome process.)
*Here are two examples why Fangraphs' K% calculations, done as K/AB, make no sense. First, assume player X has a particular K/PA in year N. In year N+1, he maintains the same K/PA rate, but increases his walk rate. Though his K/PA remains stable, Fangraphs would report his K% as having "increased," imparting negative stigma and poor analysis by persons who are not aware that K%, not on the same scale as BB% (calculated as BB/PA), does not per se indicate actual strikeout skill. Likewise, players with higher walk rates exhibit disproportionately high strikeout rates.
Ryan Howard, for example, has a career K% of 31.9 percent on Fangraphs, but has only struck out in 27.5 percent of his total plate appearances. For Howard, who strikes out a lot, this may not matter or make much of a difference if you analyze him, but for a player like Prince Fielder (career 22.1 percent K%), it does. Fielder has struck out in only 18.6 percent of his total plate appearances. On the surface, it would seem as though Brennan Boesch (20.4 percent K%) and Ryan Braun (20.5 percent K%) are "noticeably" better at avoiding strike three, but are in reality substantially the same, owning respective K/PA rates of 18.1 and 18.4 percent for their careers.
Other high walk "strikeout" sluggers, such as Geovany Soto, have K/PA rates that are lower than low-walk players with lower K% rates. Some say "well you can't strike out in a walk, so why use plate appearances in the denominator," but you also can't strike out in a hit or walk in a strikeout, and yet we accept plate appearances as the denominator for walk rate (BB%). Plus, just logically, shouldn't K% represent how likely a player is to strike out when he comes to the plate? Why make Shin-Shoo Choo's year-to-year K% like comparing apples to oranges because of a fluctuating walk rate?
Particularly where your data has an abnormal pop-up rate, HR/FB-tabulated xFIP loses a lot of its value. In fields like Oakland where there is a lot of foul territory, and in parks like Wrigley, where there is practically none, the differences in HR/FB and HR/OFFB rates might make a difference. The difference may be a couple of home runs at most (park factors only apply, in theory, in a half-step, as a player's expected number of home games is just 50 percent), but in a game of inches, such could affect Z-Scores, data distribution, etc. If memory served, HR/OFFB has also shown to be less volatile year-to-year than HR/FB.
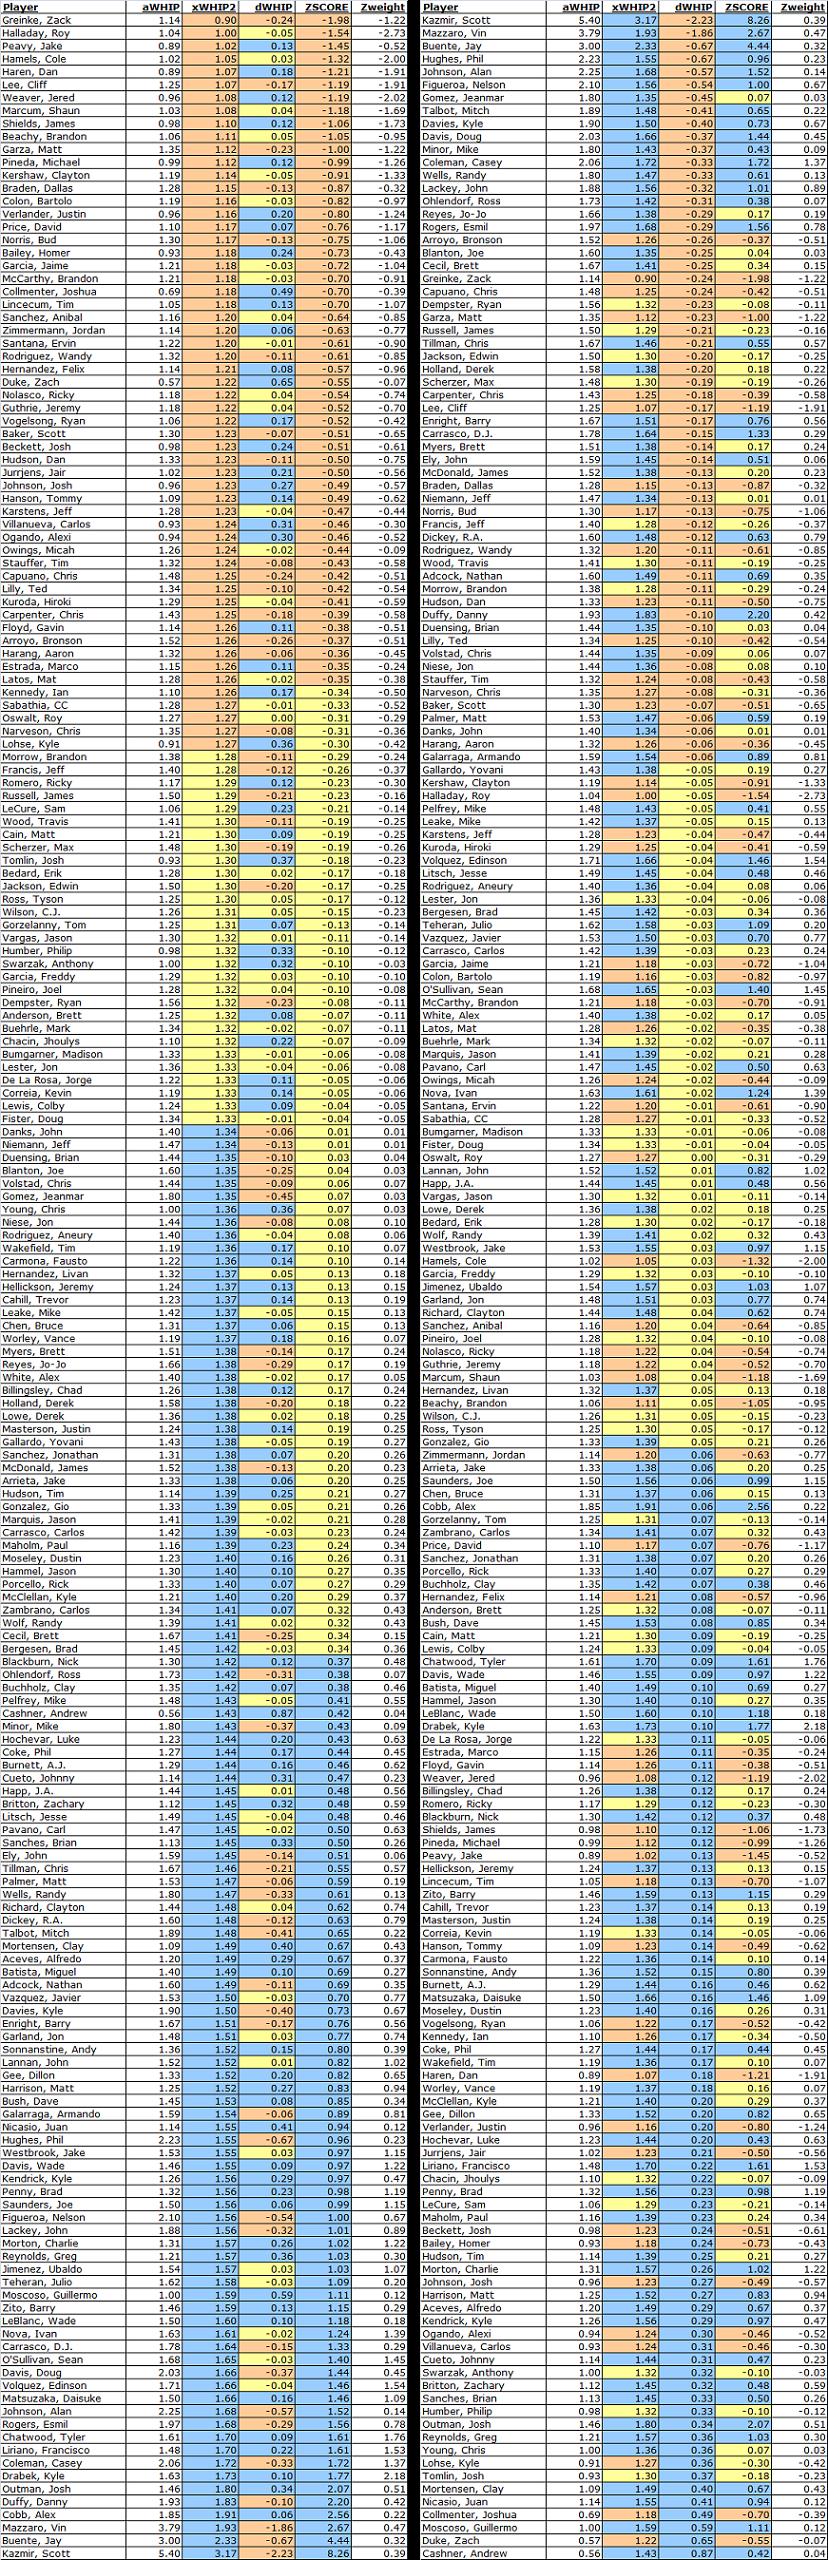
Because I have such a penchant for HR/OFFB-based calculations, including them as a data point in my xWHIP Calculator, I asked a favor of Dan, who has in turn tabulated an index of HR/OFFB rates by ballpark using data from 2006-2009. We did not have the necessary 2010 data offhand to tabulate 2007-2010 rates, but hopefully this offseason we will be able to plug in 2008-2011 data for a fresher version of these numbers.
As with Dan's 2009 post on HR/FB park factors, certain parks have less data, are weighted similarly (but without the same old data to affect the weights), and may not be as reliable. The data below regards old Twins Stadium (the Metrodome), while the Mets' and the Yankees' Park Factors are from one season only. The Nationals' Park Factor also only uses two seasons worth of data, and is weighted at 5 and 3. All other parks feature four-year weighed factors of 5,3,2,1.
Without further ado, here is the goldmine of data you've probably always wanted, but never had (at least not that I was aware of) until now, ranked from most-to-least home run inflating per outfield fly:
Team              Park                         LG    4-Year HR/OFFB
Yankees           New Yankee Stadium           AL               120
Reds              Great American Ballpark      NL               116
Rays              Tropicana Field              AL               114
Orioles           Oriole Park at Camden Yards  AL               113
White Sox         US Cellular Field            AL               113
Rockies           Coors Field                  NL               111
Astros            Minute Maid Park             NL               110
Brewers           Miller Park                  NL               108
Marlins           Dolphins Stadium             NL               108
Blue Jays         Rogers Centre                AL               107
Cubs              Wrigley Field                NL               104
Mets              Citi Field                   NL               104
Angels            Angel Stadium                AL               102
Diamondbacks      Chase Field                  NL               100
Rangers           The Ballpark at Arlington    AL                98
Giants            Pacific Bell Park            NL                97
Red Sox           Fenway Park                  AL                97
Tigers            Comerica Park                AL                96
Phillies          Citizens Bank Park           NL                93
Pirates           PNC Park                     NL                93
Athletics         McAfee Colisuem              AL                92
Dodgers           Dodger Stadium               NL                92
Mariners          Safeco Park                  AL                92
Braves            Turner Field                 NL                91
Nationals         Nationals Stadium            NL                91
Twins             Metrodome                    AL                88
Indians           Jacobs Field                 AL                87
Royals            Kaufman Stadium              AL                86
Padres            PETCO Park                   NL                79
Cardinals         Busch Stadium                NL                76
Thanks again to Dan Turkenkopf for crunching the numbers for me. As always, leave the love/hate in the comments below.