Showing posts with label The Quintessential Sabermetrics Argument. Show all posts

HR/OFFB% Park Factors

The following comes from my latest post on The Hardball Times. Because of the width of our site, to get 4-year home run per FLYBALL park factors, you'll have to go to my above link to THT.

A couple of years ago, former THT writer Dan Turkenkopf tabulated an index of single-season (2009) and four-year home run per fly ball (HR/FB) park factors. I have griped plenty about using HR/FB rates over home run per outfield fly ball (HR/OFFB) rates in tabulating xFIP many times in the past, most recently last week, because HR/FB rates include pop-ups (IFFB), which can never be home runs. The data, over large samples, may be insignificant in difference overall, but why use bad data and skew the margins? It's like Fangraphs' incomprehensible decision to use strikeouts per at-bat (K/AB) instead of strikeouts per plate appearance (K/PA) to calculate strikeout percentage*. (Dave Cameron has indicated that recalibrating Fangraphs' database would likely be a cumbersome process.)

*Here are two examples why Fangraphs' K% calculations, done as K/AB, make no sense. First, assume player X has a particular K/PA in year N. In year N+1, he maintains the same K/PA rate, but increases his walk rate. Though his K/PA remains stable, Fangraphs would report his K% as having "increased," imparting negative stigma and poor analysis by persons who are not aware that K%, not on the same scale as BB% (calculated as BB/PA), does not per se indicate actual strikeout skill. Likewise, players with higher walk rates exhibit disproportionately high strikeout rates.

Ryan Howard, for example, has a career K% of 31.9 percent on Fangraphs, but has only struck out in 27.5 percent of his total plate appearances. For Howard, who strikes out a lot, this may not matter or make much of a difference if you analyze him, but for a player like Prince Fielder (career 22.1 percent K%), it does. Fielder has struck out in only 18.6 percent of his total plate appearances. On the surface, it would seem as though Brennan Boesch (20.4 percent K%) and Ryan Braun (20.5 percent K%) are "noticeably" better at avoiding strike three, but are in reality substantially the same, owning respective K/PA rates of 18.1 and 18.4 percent for their careers.

Other high walk "strikeout" sluggers, such as Geovany Soto, have K/PA rates that are lower than low-walk players with lower K% rates. Some say "well you can't strike out in a walk, so why use plate appearances in the denominator," but you also can't strike out in a hit or walk in a strikeout, and yet we accept plate appearances as the denominator for walk rate (BB%). Plus, just logically, shouldn't K% represent how likely a player is to strike out when he comes to the plate? Why make Shin-Shoo Choo's year-to-year K% like comparing apples to oranges because of a fluctuating walk rate?


Particularly where your data has an abnormal pop-up rate, HR/FB-tabulated xFIP loses a lot of its value. In fields like Oakland where there is a lot of foul territory, and in parks like Wrigley, where there is practically none, the differences in HR/FB and HR/OFFB rates might make a difference. The difference may be a couple of home runs at most (park factors only apply, in theory, in a half-step, as a player's expected number of home games is just 50 percent), but in a game of inches, such could affect Z-Scores, data distribution, etc. If memory served, HR/OFFB has also shown to be less volatile year-to-year than HR/FB.

Because I have such a penchant for HR/OFFB-based calculations, including them as a data point in my xWHIP Calculator, I asked a favor of Dan, who has in turn tabulated an index of HR/OFFB rates by ballpark using data from 2006-2009. We did not have the necessary 2010 data offhand to tabulate 2007-2010 rates, but hopefully this offseason we will be able to plug in 2008-2011 data for a fresher version of these numbers.

As with Dan's 2009 post on HR/FB park factors, certain parks have less data, are weighted similarly (but without the same old data to affect the weights), and may not be as reliable. The data below regards old Twins Stadium (the Metrodome), while the Mets' and the Yankees' Park Factors are from one season only. The Nationals' Park Factor also only uses two seasons worth of data, and is weighted at 5 and 3. All other parks feature four-year weighed factors of 5,3,2,1.

Without further ado, here is the goldmine of data you've probably always wanted, but never had (at least not that I was aware of) until now, ranked from most-to-least home run inflating per outfield fly:
Team              Park                         LG    4-Year HR/OFFB
Yankees New Yankee Stadium AL 120
Reds Great American Ballpark NL 116
Rays Tropicana Field AL 114
Orioles Oriole Park at Camden Yards AL 113
White Sox US Cellular Field AL 113
Rockies Coors Field NL 111
Astros Minute Maid Park NL 110
Brewers Miller Park NL 108
Marlins Dolphins Stadium NL 108
Blue Jays Rogers Centre AL 107
Cubs Wrigley Field NL 104
Mets Citi Field NL 104
Angels Angel Stadium AL 102
Diamondbacks Chase Field NL 100
Rangers The Ballpark at Arlington AL 98
Giants Pacific Bell Park NL 97
Red Sox Fenway Park AL 97
Tigers Comerica Park AL 96
Phillies Citizens Bank Park NL 93
Pirates PNC Park NL 93
Athletics McAfee Colisuem AL 92
Dodgers Dodger Stadium NL 92
Mariners Safeco Park AL 92
Braves Turner Field NL 91
Nationals Nationals Stadium NL 91
Twins Metrodome AL 88
Indians Jacobs Field AL 87
Royals Kaufman Stadium AL 86
Padres PETCO Park NL 79
Cardinals Busch Stadium NL 76


Thanks again to Dan Turkenkopf for crunching the numbers for me. As always, leave the love/hate in the comments below.

Valuing Players With Your E.Y.E.S.

The following is taken from my latest article for The Hardball Times:

I have come to love the auction draft fantasy format. Tired of watching my targeted sleepers and studs go a few picks before my turn, sick of being entirely helpless and at the mercy of my fantasy provider's value rankings, I opted to work the free market in recent seasons.

The glory of auction is that every owner has a chance at every player. The auction format and bidding market equalize the stress of not having a top five pick in your league's snake draft, precluding you from one of the upper echelon elite players. Auction is not without its own stresses, however. The free market operates efficiently only when its participants are informed. Like the seller of an album of baseball cards who does not understand the value of a 1963 Topps Pete Rose card, an uninformed bidder is substantially less likely to profit on the open market.

Being informed requires more than knowing raw stats and having a player projection. Believing that Jay Bruce will hit .280 next season with 30 home runs, five to 10 stolen bases, and 85 runs and RBI is nice, but unless you know the league average player output, Bruce's projection is meaningless. Player valuation requires some appreciation of relative category weights and scarcity. To deal with this issue and weight player values, I have a methodology, which I explain below. I have also included a pricing guide applying this methodology to Oliver's 2011 preseason player projections as of Feb. 1.

First, three points that will inevitably arise:

My methodology, like any pricing guide, has an inherent limitation: the quality of the projection system. My methodology weights relative stat production, but if the projections are weak, then the pricing guide will inevitably be weak. For the purpose of this article, I used Brian Cartwright's Oliver projection system from The Hardball Times to create a pricing guide. Oliver has proven to be a very reliable system, on par with ZiPS (not released in full yet) and CHONE (now defunct). You can access Oliver's statistical projections (and more) by subscribing to THT Forecasts.

Second, for the purposes of simplification, I analyze all hitters as utility players. Some people like to adjust their numbers to account for position, but I'd rather just index the top 20 players by position after I have my Z-Score totals and know how much actual value, unbiased by position, each player is going to provide.

Third, there are better and more accurate methodologies out there. One is readily available via THT Forecasts. Another system is one created by Tom Tango a few years back. I know that Zach Sanders (of Fangraphs) and some others are working on something very similar as well. What I present to you today is merely what I do on my own, which I hardly proclaim to be unique. I am certain that someone out there probably uses, and invented before me, this same methodology to value players.

In honor of Steve Phillips, who values baseball players with his eyes and heart, I have dubbed this system of dollar valuation the Expected Year's Evaluation Statistic, or E.Y.E.S. for short.

Step 1: Determining the size of the player pool


Determining the size of your expected active player pool (those players who will be on some player's team as either a starter or bench player) is essential because only a limited set of major league talent gets used in fantasy. This is true even of AL- and NL- only formats. Because not every player gets drafted, valuing players is a two-tiered process. First, you separate potential active roster talent from "the rest." Then, you evaluate the players in the pool. This will be explained in further detail below.

Before we can determine a potential player pool, we must determine an approximate depth for the pool. Let the number of teams in your league equal X. Let the total number of drafted hitters per team equal Y, and the total number of drafted pitchers per team equal Z. For the purposes of this analysis, I am going to use a 12-team league with one of each active infield position player (C, 1B, 2B, SS, 3B), one corner infielder (CI), one middle infielder (MI), five outfielders (OF), and one utility player (UTIL), for a total of 13 hitters per team. I am also going to use nine generic pitching slots. There is also the matter of the bench. I usually play in leagues with five bench spots, which will be spit three to two between hitters and pitchers. This gives us a grand total of 192 batters and 132 pitchers, for a total of 324 players.

Of course, the player pool is quite subjective and often much deeper than a consensus 324 players. In step 2, I deal with this problem, but 192 hitters and 132 pitchers will be our starting point.

Step 2: Calculating preliminary Z-Scores


A Z-Score sounds much more complex than it really is. Okay, maybe not, but Excel (or Open Office) makes Z-Score calculations easy. Simply put, a Z-Score measures how many standard deviations from the mean (either positively or negatively) a given statistic is. For our purposes, players with high Z-Scores will help you in a given statistical category. Players with a Z-Score of 0 will have a neutral effect. Players with Z-Scores below 0 will hurt you in a category. The greater (or lower) a Z-Score, the more of an impact, for better or worse, a given player will have for your fantasy team in a calculated category.

To fill out a player pool, I first calculate the Z-Scores for every player for each of the hitting and pitching categories. For hitters, I use only a pool of players expected to accrue a minimum of 400 plate appearances. I am sure there are a few fantasy-valuable players out there who will come to the plate fewer than 400 times this season, but they are few, so I have ignored them for this demonstration. Per Oliver's 2011 projections, the pool of hitters who are expected to have 400-plus plate appearances is 436 players deep. Among these 436, the mean batting average is .265, the mean home run total is 14.0, the mean stolen base total is 8.1, the mean runs total is 62.6 and the mean RBI total is 61.0. The standard deviations for these respective categories are .019, 7.9, 7.8, 11.6 and 17.1.

To calculate any given category's Z-Score for a player, you simply take the difference of that player's stat against the mean for that stat and divide it by the standard deviation. For instance, Albert Pujols is projected by Oliver to hit 43 home runs. To calculate Pujols' home run Z-Score (labeled Z-HR in my charts), we take the home run mean(14) and standard deviation (7.9) and use the following formula: (43-14)/7.9. If you plug that into your calculator, you will find that Pujols' Z-HR is 3.67.

Now do this for every player for every statistic, and when you are done, sum up each player's cumulative Z-Score. Then repeat this process for pitchers, using wins, saves, ERA, WHIP and strikeouts. I also like to use K/9 for the purposes of evaluating pitchers.

By now, you have probably wondered how I plan to value rate stats. A .300 hitter is not nearly as valuable as a .290 hitter if the .300 hitter is getting two-thirds the playing time of the .290 hitter. To deal with this problem, I determined the average at-bat total for all players expected to accrue 400 or more plate appearances (468.8) and I multiplied the batting average Z-Score by the player's actual at-bats total divided by the league average at-bats total. This adjusts the Z-Scores for batting average to reflect playing time. I do something similar with innings pitched for pitchers.

Step 3: Distillation


Once we have a series of player Z-Score sums for batters and pitchers, we need to select the "cream of the crop" to represent the potential player pool. If you recall above, we determined that, at least for our example, our league would use 324 active players (192 batters and 132 pitchers). Accordingly, I begin by selecting the 192 batters and 132 pitchers with the highest Z-Score sums. These players should represent our best "all-around players" for drafting.

This is not the end of step 3, however. Fantasy teams are dynamically comprised and owners often draft one or two category guys to fill holes and to stream. To account for this, I then rank the residual player pool by categorical Z-Score. I then pull out any player with a Z-Score of 1.0 or higher in any fantasy category. I also add any remaining players who I think are "interesting" to my player pool, even if their categorical Z-Score is less than 1.0, as $1 buys to keep an eye out for. Not even the best projection systems gets every player right, and this element of player selection requires personal judgment. For instance, Oliver is incredibly bearish on Aaron Hill, who I like for 2011. His Z-Score sum is not within the top 192 and he does not have a Z-Score of 1.0 or greater in any single category. Nonetheless, I added him to my player pool.

Doing this, I ended up with 235 hitters and 166 pitchers, for a grand total of 401 players. This seems reasonable.

Step 4: Calculating primary Z-Scores


Now that we have our pool of 401 players, we need to recalculate our Z-Scores to reflect the draft pool talent. If you want remotely reliable numbers for draft day, it is pointless to value player X against undrafted players. These 401 player represent the best of the fantasy crop, and accordingly, the means and standard deviations in each category between them will change. Among the 235 hitters in our example sample, for instance, the mean batting average jumps up to .272 (from .265), the mean home run total jumps to 17.2 (from 14.0), the mean stolen base total jumps to 10.6 (from 8.1), the mean runs total changes to 70.4 (from 62.6), and the RBI total bumps up to 69.1 (from 61.0). The standard deviations also change to 0.018, 8.8, 9.3, and 18.0, respectively. The average expected at-bat total also rises from 468.8 to 497.2.

Re-calculating and re-summing each player's Z-Score, we are left with the expected relative value weights of each player.

Step 5: Calculating dollar values


Once we have relatively weighted Z-Score sums for each player, we now need to determine each player's dollar value.

To calculate dollar values, we must determine the total amount of money in our fictional economy. Simply put, we need to determine how much money exists to be split among the players with positive Z-Scores (all players who are ultimately assigned Z-Scores below $1 will have their dollar values rounded up to $1). Using the standard $260/team budget, applied to our 12-team fictional league, we find an economy with $3,120 in it. In real life, you could barely buy a pimped-out MacBook pro with that money, but here you can buy CC Sabathia!. Alas, I digress.

Take this $3,120 total and divide it by the total Z-Score sum across all hitters and pitchers. The Z-Score sum from which to divide the economy value by should not include any players with negative Z-Scores; ignore these players for the sake of Z-Score valuation. Doing this will give you a rough dollar value estimate per Z-Score. Take this dollar value and then apply it to each player's Z-Score to get your estimated dollar value for that player.

Keep in mind that the minimum bid for any player is $1. Certain players in our draft pool, particularly the "one category" players (hitters or pitchers with a Z-Score of 1.0 or greater in only a single category), have Z-Scores below 1.0. Other players probably have Z-Scores that, when multiplied by our Z-Score dollar value, have Z-Scores under $1. Because these players will actually cost you at least $1, all players with dollar values under $1 are rounded to $1.

And there you have it. That is how you can calculate dollar values (EYES) for auction on your own. Use your EYES (not your heart) on draft day! Empower yourself with information. Of course, you could also do none of this analysis, save yourself some time, and purchase a subscription to the substantially more accurate THT Forecasts, which has its own built-in pricing guide for Oliver. I guarantee you those numbers are much better than mine.

A Quick Rant About The NL DH

My always interesting college Anna McDonald posed an interested thought earlier today about the NL and the use of a DH in the World Series. Implicitly, she posed the question of whether the DH was an advantage or disadvantage for NL teams.

En point, I rant accordingly, and conclude that it does.

The average NL team's starting line up consists of eight hitters and a pitcher who also bats. The "ninth" hitter for NL teams is a bench player. Given the fact that pitchers generally cannot hit and that bench players see limited and infrequent playing time, an NL team trying to optimize their starting lineup has little incentive to "pimp out" the bench. Rather, an NL team has an incentive to focus their resources on maximizing the talents of their other eight starting hitters. A team's batting resources, therefore, will be primarily focused on eight hitters, with the residual going to the bench -- which optimally is designed to be deep rather than feature a "stud."

On the other hand, the AL has seven starting hitters (thanks to the DH) and hence has an incentive to invest in that ninth hitter, who is essentially a "batting specialist." There is less of a focus on the "deep bench," instead finding an effective ninth hitter to slot into the daily line up.

Thus, comparing the AL to the NL, one notes a clear difference in strategy due to the league's traditional lineup composure: the NL has an incentive to maximize the primary eight hitters and diversify the remaining resources amongst the bench, while the AL has an incentive to spend on nine hitters (creating a polarity between the NL's 9th guy and the NL's 9th guy).

So what is the point?

Well, this explains, in part (the other part being sample size), why the average NL DH (as derived from interleague play) tends to function less effectively than their AL counterpart. In 2010, for example, the average major league DH hit for a .699 OPS, while the average AL DH hit for a .757 OPS.

in 2010. NL DH's hit for a .649 OPS. This makes sense because NL teams focus on bench depth, not having a best "#10 hitter", whereas the AL invest directly in their DH (he plays regularly). Meanwhile, the average NL DH only hit for a .649 OPS. This disparity is also observable in 2008, 2007, 2006, 2005, and so on (2009 seems to be an exception...).

This of course, noting the above incentive structure, make sense. NL teams, who use pinch hitters more frequently than a "ninth hitter" have a greater incentive to diversify the bench than polarize said resources in a "reliable" ninth hitter. Meanwhile, AL teams have a pervasive need for a "reliable" ninth hitter. Furthermore, the AL has a hitting specialist whose sole value derives from his batting skills, whereas the NL's ninth, tenth and eleventh batters all derive value not just from batting, but also playing the field. This is because 1) there is no DH in the NL and because a fielding pinch hitters gives an NL manager greater lineup flexibility. Thus, it makes more sense that the AL's DH would be of higher quality than the average NL DH.

In terms of the World Series, therefore, it is the AL who inherently gains the advantage through the use of the DH. Whereas both teams may have equally poor hitting pitchers, the AL teams tend to have the clear upper hand in terms of ninth hitters. Of course, this assumes that the distribution of potential talent between teams is uniform, which is ridiculous to say the least, but it indicates that in a vacuum, between two teams with equal access to talent, the AL has an upper hand at the plate when they play at home.

Or maybe none of this makes a lick of sense. That is also entirely plausible.

Linear Weights And Ichiro Suzuki

Taken from The Hardball Times:

Depending on when a given event occurs in a baseball game, it will have a different impact on the runs scoring differential. A single, for example, is worth almost twice as much with a runner on first than it is with the bases empty. These events, based on when they occur, are compared through the use of linear weights (or relative valuation).

The linear weight system is interesting because it lets us see what would happen to runs scoring in theory if we substituted one event for another. For example, what happens to run scoring if a hitter improves his patience at the plate by also increasing the number of times strike three is called. According to Tom Tango's Men On Base Linear Weight System (MOBLWTS), a base on balls is, on average across all possible events, worth +0.35 runs, while a strikeout is comparably worth -0.31 runs. Thus, a player who improves his walk rate at the expense of a comparable decline in strikeout rate is actually improving his runs output.

A few years ago, Ichiro claimed that he intentionally sacrifices power for batting average. Would hitting 40 home runs at the expense of a lower batting average, and thus on base, really hurt Ichiro's run scoring output? Let us examine.
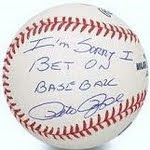
Under that linear system, the average home run is worth +1.42 runs, while the average single is worth +0.49 runs. This means that a home run is roughly equivalent to 2.9 singles. Ichiro has averaged about 8.5 home runs in his nine-year major league career. If we assume that Ichiro could hit 40 homers, that means that he would need to increase his home run output by 31.5 to match his claimed ability.

Using the relative weight of home runs to singles and singles to outs (assuming all non-home run hits sacrificed by Ichiro would be outs), we get a proportion of 1.42(Y)-.30(X-Y)=.49(X), where X equals the number of singles Ichiro would have to hit to "break even" in regard to his run-creation output.

Simplifying the equation, we get: X = 2.18Y. Plugging in the relevant numbers, we find that to "break even," Ichiro would need to hit these additional 31.5 home runs at the expense of 68.5 (or fewer) singles. Ichiro averages about 678 at-bats per season with a batting average of .331 (~224 hits). The loss of 68.5 singles (again, we are pessimistically assuming that all of Ichiro's forgone singles would become outs) would cause Ichiro's batting average to plummet to approximately .229.

Hence, if, as Ichiro claims, he could hit 40 home runs at the cost of a .220 batting average, then he should not do it. Exacerbating the issue, as a commenter points out below, would be that a loss in batting average would also depress Ichiro's on base and stolen base value, which would further lower his overall wOBA. Still, the issue would be a closer one if "Ichiro with power" was be capable of mustering a batting average that is competitive with the likes of Mike Cameron, Adam Dunn, and Russell Branyan, the trade off may be worth it. As is stands, however, ".220 Ichiro" should keep on slapping singles...

What do you think?

The Greatest Football Game Ever Played

* in my opinion, and that I can remember

For those of you who follow fangraphs and sabermetrics pretty extensively, you know what WPA is. For those of who you do not, WPA stands for Win Probability Added. Let me try to explain this in extreme layman's terms. During the start of a baseball game, the exact odds one of the teams will win the game is 50%. I don't care if it's the Pittsburgh Pirates facing the New York Yankees, at the start of the game, the Pirates have a 50% change of winning that individual game. But throughout the course of the game, the odds a particular team wins the game changes. If Derek Jeter is the first batter of the game and he hits a home run, the odds of the Yankees winning the game slightly improve. There are still 27 outs for each team to work with so the Yankees don't get a huge edge at that point in the game, but their odds do increase and the score is becomes 1-0.

However, if the score is tied, it's the top of the 9th, and Derek Jeter hits a home run to lead off the inning, well the odds that the Yankees will win the game increase dramatically. In both instances the Pirates are down by one run but the odds they can come back to win the game are different because of the amount of outs they have to work with.

The odds a team wins the game is how to determine WPA. According to Fangraphs, the definition of WPA is
the difference in win expectancy (WE) between the start of the play and the end of the play.
And how each player does to affect the odds of his team winning the game helps goes into determine his indivudal WPA. According to Fangraphs:
That difference is then credited/debited to the batter and the pitcher. Over the course of the season, each players’ WPA for individual plays is added up to get his season total WPA.
Here's an example Fangraphs gives to help quantify this:
In Game 4 of the 2007 World Series, the WE for the Rockies started out at 50%. When Jacoby Ellsbury doubled off Aaron Cook in the very first at-bat in the game, the Rockies WE declined to 44.2%. The difference or WPA was .058 wins (5.8%). Ellsbury was credited +.058 wins and Aaron Cook credited with -.058 wins.
This same exact approach can also be applied to football.

In 1988, Bob Carroll, John Thorn, and Pete Palmer became the Bill James of football. That year they published and released the book The Hidden Game Of Football which was the world's first introduction to advanced statistics for football. This book sets the foundation for websites like Football Outsiders and Advanced NFL Statistics.

In the book, they talk about the odds a team most likely is to win a game. In baseball, all you have is 27 outs per team to score as many runs as possible. Therefore, the three main factors to determine WPA are: how many outs are there left in the game, how did you get on base/ who is already on base, and what the score of the game is. However, in football, you not only have to deal with the clock, but you also have to deal with downs. Therefore, there are five main factors that goes into football WPA: what the score of the game is, how many downs are left, how many yards did the last play gain, where you are on the field, and how much time is there left to play.

In baseball, a home run to lead off the game has a far less impact on the WPA of the game that a home run to break a tie in the 9th inning. In football, a 20 yard pass to start the game has a far less impact that a 20 yard pass to start your last drive on the game in a tie. Along similar lines, a three yard rush on 1st and ten has a far less impact on a team's WPA than a three yard rush on 3rd and two. Along more similar lines, the aforementioned play has less of an impact than a three yard rush on the second to last play of the game allowing your kicker to kick a 47 yard field goal as opposed to a 50 yard field goal to win the game.

The Hidden Game Of Football laid out in detail the odds of scoring points. Plus, basic logic says it's a lot harder to drive 99 yards down field to score a TD than 49 yards. In fact, it's this logic that's it's not necessarily a bad idea to go for a TD on 4th and 1. Because if you don't convert the 4th down to score, you still have a pretty good chance to score again due to the fact that it's EXTREMELY hard for your opposing team to score so most likely you have have great field possession on your next drive to score again. For anyone that saw Week One Bears vs. Lions, this happened. Matt Forte and the Bears failed to convert 4th and 1 so the Lions got possession of the ball on their own one yard line. They failed to make a first down to the Bears got great field possession on their next possession. In fact this happened for like three straight drives- this back and forth. (I'm sure this has happened at least once to every NFL franchise and/or it's opponent)

Now that I have briefly explained what WPA is, I will now show you what I think is the greatest football game I have ever seen: and that was the Week Six game between the Chicago Bears and Arizona Cardinals in 2006. This also led to my favorite post season rant of all time. "The Bears are who we thought they were!". Here is the WPA for that game:


At halftime, the Arizona Cardinals had essentially locked this game up. With 5:53 left to play, the Cardinals were winning 23-10. At this point, the Cardinals had a 99.97% of winning this game. Then, 42 seconds later, Brian Urlacher recovers an Edgrerrin James fumble and scores a touchdown. However, at this point, the Cardinals still had a 66% chance of winning this game (as the score was still 23-17 in Arizona's favor). Then with 3:17 left to play, Devin Hester returns a punt for a touchdown giving the Bears their first lead of the game 24-23. Within a matter of about two minutes, the Cardinals go from a 66% chance of winning down to a 66% chance of losing. But Arizona got the ball back and marched down field. At the 1:04 mark, that 66% chance of losing rose to 78% chance of winning. Even if Arizona doesn't get a touchdown, they still get an easy field goal to win the game 26-24. But as Neil Rackers kicked a 40 yard field goal with 52 seconds left to play, the ball went wide left and the field goal attempt was no good. And with that kick, Arizona's 78% chance of winning the game went to a 2% chance of the winning the game. And 52 seconds and a few kneel downs later, that 2% diminished to 0%.

Now those two numbers in the bottom right corner indicate the's game Excitement Rating (out of 10.0) and Comeback Rating (out of 100). According to the WPA, the excitement rating was just below average, but the comeback rating was perfect. So you can make the argument that this wasn't the greatest game ever, but just the greatest comeback. Sure, you can make that argument.

Source of WPA and a the WPA chart: Advanced NFL Stats

EPILOGUE

Now I hope this post also gave you a great introduction into WPA- for both players and teams. In baseball, we don't use WPA to determine who the best player is, we use a great stat called WAR- which takes into account the quality of a player's offense and defense and compounds it into a nice round number for us. But football does not have that statistic and it probably never will. As Bill Bramwell, co-author of Football Outsiders, says on the Freakonomics blog:
We’re nowhere near the point of valuing a player as being worth a number of wins, because we’re light-years away from quantifying all the things a player does. I doubt we’ll ever have a reliable “wins” metric because there are too many interactions between positions that we can’t account for in football. Take a quarterback, for example: even if we were to develop a measure of performance that stripped out the effects of his receivers and offensive line and placed his passing performance in a perfect, league-average context, we’d have to account for how he read defenses and called audibles at the line, how effective he was in setting up defenses on the play-fake, whether he had any impact on the running game versus an average quarterback … it’s not a realistic goal.
WAR can help determine exactly how many wins a particular player contributes to his team in baseball. But because of the dependent nature of football, we will probably never get to that point. However, WPA comes really close. Although we can't account for the audible a QB makes to switch from a pass play to a run play so his RB can gain ten yards, we can account for actual results that occur.

And let's face it, all we want are results. We want to see our team's offense drive down the field to score points and we want to see out team's defense stop the opponent from scoring points. We don't really care how that result occurs (although we love to argue about it) as long as it does. And that's why I think WPA is a great step in the right direction to help isolate how players have performed.

But like I said, WPA is not the end all, be all. Advanced NFL Stats also has a stat called EPA (Expected Points Added) and Football Outsiders have some great stats called DVOA and DYAR. I also don't think this has a very good predictive element at all so I wouldn't use it for fantasy purposes or for predicting statistics the year after. But I think they are great statistics for helping you explain the past.

xISO By Batted Ball Type

According to data compiled by Dan Fox, the expected slugging percentages (xSLG) for a batted ball type from 2003-2006 look as follow:
  • Popups: ~0.024
  • Groundballs: ~0.262
  • Flyballs: ~0.762
  • Line Drives: ~1.014
Taking this one step further and calculate xISO by batted ball data, here are the xBABIPs from 2004-2008 based on batted ball type, courtesy of ESPN's Tristan Cockroft:
  • Popups: NO DATA, but Tom Tango puts it at approximately .020.
  • Groundballs: 0.239
  • Flyballs: 0.138
  • Line Drives: 0.725
Using these two data sets, here are the xISO per batted ball type:
  • Popups: 0.004
  • Groundballs: 0.023
  • Flyballs: 0.624
  • Line Drives: 0.289
To put these numbers in context, a guy with a .200+ ISO probably has 25 HR power.

Using Fangraphs' batted ball profile data, I have created a spreadsheet (which you can download by clicking here) which ranks guys based on GB%+IFFB%. In essence, it is a list which ranks players from guys who are most likely to post low ISOs this year to guys who are least likely to post a low ISO this year. Guys who lead the majors in GB%+IFFB% (and are thus likely to post low ISOs this season if all remains constant) include Hunter Pence (0.143 ISO so far this season), Lastings Milledge (.071 ISO), Rajai Davis (0.052 ISO), Chris Coghlan (0.009) and Troy Tulowitzky (0.118), strangely enough. Guys not likely to post low ISOs include Alfonso Soriano, Jayson Werth, Adam Dunn, Josh Willingham and Nick Swisher.

QUESTION: Why does Aramis Ramirez, who is hitting 60% of his total batted balls in the air (the highest rate of his career), doing so poorly this season? Perhaps its age. Perhaps its lingering shoulder problems (just ask Geovany Soto). Maybe it's the 25% popup rate on fly balls. Maybe it's the MLB-lowest .179 BABIP...it's a situation worth monitoring. If these stats continue, the BA should remain low, but the ISO, which currently sits at 0.095 (thanks to 1 xBH (a double) since April 17), should rise. Ramirez has the 7th lowest GB%+IFFB% in the majors this season.

CAN YOU GUESS THE PLAYER?: Take a guess which MLB player currently stands alone, thanks to Chris Coghlan's double last night, with a 0.000 ISO (that is to say this person, and only this person, has no extra base hits on the season). Hint: he's top 10 in GB% this season.

The Quintessential Sabermetrics Argument: FIP and xFIP

A quintessential component of The Quintessential Sabermetrics Argument: Batting Average was that a lot of batted ball data tends to normalize because hitters do not have as much control over balls in play (BIP) as commonly believed. True, players who consistently make certain kinds of contact more often can maintain higher BABIPS, as can speedsters, but once the ball is in play, whether or not that balls is a "hit" is highly dependent on the positioning and ability of the defense.

From here, we turn from batters to pitchers. A pitcher controls a few things about the outcome of an at bat, each to a variable degree:

  • A pitcher is in almost absolute control over the general location of his pitch. There are some marginal variants such as temperature, wind speed and wind direction in effect, but a pitcher who does not hit his spots can generally only blame himself. He either gripped the ball incorrectly, released it too late, "has the jitters," just can't pitch, etc. The location of his pitch is something in his control.
  • A pitcher also almost completely (though less completely than location) controls intentional walks. The Jeff Francouer and Miguel Cabreras of the world aside, if a pitcher wants to intentionally walk a batter, it will happen.
  • Compared to intentional walks, a pitcher exercises less control, but still a large degree of control, over unintentional walks. Unintentional walks integrate the batter more into the outcome equation and the result is less guaranteed (largely because players like Bengie Molina and umpires like Tim McClellan do not understand the concept of a strike zone). Generally speaking, however, a pitcher controls the general location of his pitches and batters will more often than not lay off pitches outside of the zone.
  • A pitcher exercises much less control over strikeouts than he does walks, but he still exercises a large degree of control over them. This decline in control over the outcome occurs because the batter is more integrated into the strikeout process. Whereas with walks a player takes a passive role, the hitter is now taking active participation against the pitch; he can lay off or swing and the result will either be contact or no contact. A pitcher with deceptive release points, sharp break and a large velocity disparity between pitches will tend to "fool" batters more often, whereas hitters can more easily square up straight pitches with no movement. Although the pitcher controls the type of his pitch, the degree of deception, the movement, etc., he does not control whether or not the hitter will be able to guess where the ball's true location will be. What the pitcher controls, therefore, is the ability to influence batter's probability of contact; we just simplify this statement in the form of "strikeouts."
  • As we move from no contact to contact, the degree of control a pitcher exercises over the outcome of an at bat declines further. A pitcher does not control the actual outcome (type of contact) of the at bat (this is because there is no magic "groundball-only-and-always" pitch), but he does exert influence over the tendency of type of contact to result from the at bat. A pitcher who throws pitches with sharper break is more likely to have a hitter get "on top of the ball" and chop it into the ground.
  • A pitcher does not, however, control the strength of the resulting contact. I would say that pitchers with more deceptive "stuff" are more likely to induce weaker contact than the average pitcher, but once the ball is out of their hands, the question of contact becomes something only the hitter can answer. The ball en route, the hitter must guess where and how to swing. Assuming he does not strikeout, if he guesses poorly, the result with be weak contact -- an infield flyball or weak grounder. If he guesses correctly, the resulting contact will be stronger and harder hit.
  • Because the pitcher controls the tendency of the ball to be in the ground or in the air, but he does not control how hard it will be hit on the ground or in the air or how far, then it makes sense that a pitcher does not control home runs; only the tendency thereof. Pitchers face so many batters that we can generally assume that the average hitter they will face will have "league average" power. The guy with the league average power hits just over a home run per every 10 flyballs he hits. We call this HR/FB rate (I prefer HR/non-GB rates as a whole, as line drives also turn into home runs sometimes, but HR/FB rate is sufficient for our purposes). The league, as a whole, averages a HR/FB rate in the 11% range, though most pitchers have HR/FB% which normalize to the 9-12% range (depending on where they play). Pitchers, over a large enough sample size, regress into this range because they do not control how hard batters will hit their non-groundball-resultant offerings. Since 2002, 73 pitchers have cumulatively thrown 1000+ innings. Of them, only Jason Schmidt (7.5%), CC Sabathia (8.4%), Cliff Lee (8.5%), Barry Zito (8.6%), Mark Redman (8.8%), Jarrod Washburn (8.8%), Roger Clemens (8.9%), Pedro Martinez (8.9%), Odalis Perez (12.3%), Nate Robertson (12.7%), Derek Lowe (12.7%), Brandon Webb (13.2%), and Brett Myers (15.5%) -- at total of 13 pitchers (five of whom just barely made the cut) -- did not fall into the 9%-12% HR/FB ratio range. Of them, Lee, Sabathia, Zito, and Washburn pitched at exteme home run suppressing parks for most of the sample size, while Webb and Myers pitched at extreme home run exaggerating parks. You might also notice Derek Lowe and Brandon Webb's presence here, despite being the league's two most extreme groundball-oriented pitchers; this only further drives home the point.
  • Does a pitcher control pop ups? A pitcher certainly controls flyball tendencies, but it is uncertain if "inducing pop ups" is a skill possessed by pitchers. Certainly 2002-2006 Barry Zito would have you believe so. I have no seen any conclusive scientific evidence either way, but I can affirmatively state that pitchers who induce more infield flyballs tend to have lower BABIPs.
  • What about hits? A pitcher exerts almost no control over non-home run hits. As mentioned above, once the ball is out of the pitcher's hand, it is out of his control (at least from the perspective of pitching ability). Once the ball is put in play, it is the fielders who determine whether or not a ball is going to be a hit. The pitcher may control the direction of the ball, like he does the type of contact, but it is the hitter's guess of the pitch (often which is random in and of itself) which determines if it is a ball down the line, right to the third basemen, hit to the gap, etc.
  • Left On Base Percentage (LOB%) is another element that pitchers exercise very little control over. Although better pitchers tend to have higher LOB%, LOB% nonetheless regress to some mean, whether it be that of the league average or player's career average. The reason why is very closely related to the "pitcher does not control hits" argument. Because the pitcher does not control if a specific at bat where contact is made results in a hit, a pitcher does not control when contact is made. This means that they do not control BABIP by leverage (a term used to describe how important or impactful upon the probability of outcome a specific situation in a game is). Sure, a pitcher is more likely going for the strikeout or for a groundball when there are runners on base and the game on the line, but the BABIP results and contact% generally remain stagnant over large enough sample size comparisons of situations with variable leverage indexes. This goes towards that whole "there is no such thing as clutch" argument.
  • From all of the aforementioned reasons, it is important to look beyond ERA and WHIP in evaluating a pitcher's true ability beyond the success he does or does not experience in a single season. ERA measures single-season results with all the non-neutral luck variables factored in. Using ERA to identify a pitcher's talent is like trying to identify a pieces of strawberry in a finely blended all-berry smoothie (food metaphor). We need to look beyond what a pitcher does not control and into what a pitcher does control. This is where FIP or Fielding Independent Pitching statistics (which you may know it as DIPS, or Defense Independent Pitching Statistics) comes in handy. The statistical analysis grunt work has already been done (thanks to Tom Tango) and the coefficient of determination is pretty high (approximately five times that of ERA).

    FIP is a better measure of future success than ERA. FIP essentially takes the three elements a pitcher exerts the most control over (K's, BB's and HR's) and weights them in regard to their historical impact on ERA and then adds to them a league-specific factor to round out the resulting number to an equivalent ERA number. The formula for calculating FIP is 3.2+((13*HR)+(3*(BB+HBP-IBB))-(2*K))/IP. ERA tends to regress towards FIP over time. It likely will not match it (too many variables at play), but you can determine whether a player is likely to improve or regress in the future based on FIP-ERA differentials (FIP-based trading and team management is a cornerstone of fantasy baseball success).

    But wait, DME, you say, didn't you just say, and I quote, "a pitcher does not control home runs; only the tendency thereof?" You are correct and this brings me to the advanced form of FIP I prefer to utilize called expected FIP or xFIP ("x" is a general term you see in front of statistics to represent some predicative value). xFIP is similar to FIP in how it incorporates the historical weight of K's, BB's and HR's on ERA, but whereas FIP uses a pitcher's in-season home run totals to calculate a pitcher's in-season FIP, xFIP uses a metrics we might call xHR, where xHR is a specific function of the league average HR/FB rate. xFIP measure's a player's future ERA under the theory of HR/FB rate regression.

    There is another FIP-like metric out there called tRA, which utilizes a pitcher's total batted ball profile to evaluate his luck-neutral results from a single season and predict a player's future ERA. tRA is not exactly scaled to reflect ERA, so it can be a bit confusing. I personally do not use tRA because I do not believe a pitcher controls "line drives" (at least not as classified and encapsulated in box score data).

    From all this explanation and ramble, we derive the following maxims. A pitcher who walks less batters, strikes out more batters and keeps the ball on the ground is likely to succeed. A pitcher who induces more contact and pitches for the 2007 White Sox is not.

    The Quintessential Sabermetrics Argument: DVOA and DYAR

    Cubsfan4evr once asked me what the most important stat of football was. We spent some time thinking about this and the ultimate answer we came up with was: points. We tossed around total yards, but does it matter of you have 200 more total yards than your opponent of you lose the game by one? (see Minnesota/ NO NFC Championship game). However, we debated yards so much because it really does play an integral part of the game. Obviously, it's really hard to score if you don't move down the field to get into FG range/ get a TD. I want this to be in the back of your mind when reading this post.

    Here's some examples for you:

    Player A: 18/30 for 300 yards, 3 TDs, no INTs or turnovers

    Player B: 18/30 for 300 yards, 3 TDs, no INTs or turnover

    Logic would tell you that both Player A and Player B each had just as good of a day because both had the same exact stat line. But let's say Player A was facing the worst defense in the league and Player B was facing the best. This changes your perception on who has the better day doesn't it? Player B then clearly had the better day because Player A should have put up better stats than Player B, yet he did not.

    Another example:

    A RB gains six yards on first down. That player has greatly helped his team because it gives the team a greater chance to get the first down. If that team gets the first down, it's easier for that team to move down the field and gives them a better opportunity to score points. Now let's say that same RB gains six yards, but this time it was on 3rd and 7 and the team is then forced to punt. That RB still got six yards (which still shows up in stats like Yards Per Carry (YPC)), but the result on his team is drastically different.

    What can we learn from these examples? Well from example one, we learn that defenses are important. It's a lot easier to put up stats against a crappier opponent than it is against a more difficult one. From the second example, we learn that situations and downs are important. When we combine these, we learn that we must judge players based upon the specific situations that they are in.

    However, to judge these players against everyone else in the league, we must compare these specific situations versus how other players in the league would do in those specific situations. If the average RB in the league only gains 2 yards on 3rd and 7 situations, then even though our RB in the second example only gained 6 when the team needed at least 7, he still did better than what a lot of RBs would have done and he still gets a bit of a edge.

    This is the groundwork for what I call football sabermetics and what the site Football Outsiders (FO) does. Even though FO does not actually call their statistics football sabermetrics, I mean let's call a spade a spade.

    Here's another example for you.

    1. The Giants drive 80 yards to get a TD. Tiki Barber gets 45 of those yards, Eli Manning gets 30 of those, and Brandon Jacobs gets a 5 yards TD run.
    2. Tom Brady is on his own five yard line and gets intercepted by Bob Sanders. On the next play Joseph Addai runs into the end zone for a TD
    3. The Carolina Panthers drive 80 yards to get a TD. Jake Delhomme gets 20 yards going 4/4 (I'm sorry Panthers fans but this is just a hypothetical) and DeAngelo Williams gains 60 yards on 8 carries with the TD.

    In each of these scenarios, the RB gets the TD. Yet in each of these scenarios, did the RB deserve the TD run? DeAngelo Williams absolutely did, but did Jacobs and Addai? This is another example of where each situation is different and this is also something DVOA takes into account. This also shows how surprisingly unimportant individual TDs can be. This seems counterintuitive because this goes what was just discussed in the beginning- it's not really about yards, but all about the score. However, that's not necessarily true on an individual level. How individual players get to the points is actually more important than the points themselves. Mike Alscott spent years vulturing TDs away from Warren Dunn. Dunn got the yards but Alscott got the TD. Yet you ask anybody which one was the better RB- and they'd all say Dunn. Again, this is on an individual level to judge how good an individual player is.

    FO says it perfectly, "DVOA does a better job of distributing credit for scoring points and winning games by using a value based on both total yards and yards towards a first down." I've used DVOA in many, many posts, but let me explain it to you better. In laments terms, DVOA rates players compared to how the league average would have done in that same situation. DVOA is used for all aspects of the game, but for our purposes today, I'm just gong to discuss it within the aspect of a QB, RB, TE and WR. If a WR has a 10.0% DVOA rating, that means what they do is ten percent better what the league average player would do, and if that same player has a -20.0% DVOA rating, that means a replacement player could have done a 20% better job than that player. For you baseball guys, think of DVOA as analogous to VORP.

    DVOA stands for Defense-adjusted Value Over Average. It is first compiled by finding VOA (guess what that stand for?) by looking at how every single situation played out, it's success and failures, and then looks to see how that individual player did in relation to how the rest of the league did (this goes back to the example of a RB gaining 6 yards when the average back would have only gained 2). But as we've stated before, how that player does against a certain defense also matters. So that VOA is then weighted against what defense the player is facing and the position their offense is on the field.

    However, DVOA only ranks how an individual player does per play (analogous to YPC). But there is some value of a player that continually produces- even if it's only league average. That's where DYAR comes in. The example FO uses is: let's say you have a RB that carries the ball 300 times in a season. Now, let's take that player out of the equation, what happens to those 300 plays? Normally, a team would put in a league average player (again VORP at work). However, which back up would you rather have: Maurice Jones Drew or Fred Taylor? When MJD was playing with Taylor, he was technically the back up but obviously the better back. Now how would you rather have, Peyton Manning or Jim Sorgi? What about Tom Brady or Matt Cassel? Everybody's back up is different so those extra 300 plays isn't necessarily weighted against you're individual back up- but to how league average back ups have done in similar situations using DVOA. Therefore, how you perform as a whole compared to how a back up would do is weighted on a scale to produce DYAR- Defense-adjusted Yards Over Replacement.

    Let me also give you a great example now of the disparity between perception based on "normal" stats and football sabermetrics- Adrian Peterson. Adrian Peterson is widely regarded as one of, if not, THE top running back in the NFL. If you watch him play and break tackles- it could be magical. You hear all these great features ands skills AD has and you see how good he is in fantasy and you think he is Jesus. But when you use football sabermetrics, he's good, just not Jesus good. Last year he was 12th in DYAR and 22nd in DVOA (3.3%). When you compare him to how he did against similar defenses and situations versus other RBs- we was just good. His value came in that he got a lot of carries as shows by his DYAR ranking.

    Now I fully admit DVOA and DYAR should not be used in the same way that WAR and UZR and BABIP and wOBA is used. Football is still a team sport versus baseball which is extremely individualized. There are still systems and lines that affects an individuals play and frankly there's a bit of distrust I have towards the stats still. But I think it's great evidence towards judging a players true worth.

    If you're still interested and want to learn more about how to better analyze football, read The Hidden Game of Football, the landmark book that paved the way for FO.

    You can also read, FO's explanation of DVOA and DYAR here.

    Quick DH Rant

    Disclaimer: I do not like the DH (which may seem odd as I have a degree in economics and am essentially saying that I do not believe in the division of labor) and I am not here to defend its existence in baseball. I am simply here to defend an underappreciated DH who belongs in a DH-only role.

    I was listening to 670 THE SCORE earlier today, and heard a strange comment by Mully and Hanley. Mully and Hanley tried to say "hey look, we love Jim Thome and appreciate all that he's done for Chicago, but he was only a 1 WAR player last season" (in actuality, Thome was a +1.5 WAR player in 3-4 months (he did not play in NL-interleague games) of ABs for the White Sox as a DH, and a -0.2 WAR player off the bench for the Dodgers in extremely limited ABs). Bless their hearts for trying to use Fangraphs and sabermetrics to support their arguments, but it's important to use the statistics right for them to be valuable and effective.

    True, Thome is aging, worth "only" about +2 WAR pr 600 PAs and is also limited by both age and health to a DH-only role. +2 WAR is still valuable, but let's just say it's not enough for the Sox. What Mully and Hanley didn't account for, however, is that DH's generally have limited value in general because they provide one-side of the game contribution and get a -17.5 run reduction (-1.7 WAR) from their batting line. In other words, any DH is inherently less valuable and going to have limited value in comparison to "other baseball players" who play the field.

    If you are signing a player in general who will play the field, you want a guy who will maximize his total contribution. In the average player, this contribution is a combination of position, offense and defense. Because there are more inputs for the non-DH, a non-DH who does not have Adam Dunn-like fielding abilities will inherently have a higher WAR; especially if they play a premium position like SS. The higher the WAR, the better the player. Teams want +5 WAR guys over the +3 WAR guys and the +2 WAR guys over the +1 WAR guys.

    However, the perspective of evaluation must change slightly when you look to sign a DH-only player. A DH-only player only contributes offense. His WAR will be negatively impacted by the fact that he is a DH, no matter how good his bat is. If player A and player B are both equally good at offense, but player A is an average defensive LF (-7.5 run adjustment, +0 fielding runs) and player B is a DH (-17.5 run adjustment), WAR would not be the best method to evaluate which player to sign if you are looking to sign either A or B to a DH-only role. Player A looks better because his WAR is likely to be a full integer higher than B, but that does not mean A will be more valuable than B in the DH-only role. What teams should be looking at when evaluating prospective DH-only role players is not "who had the better WAR," but who had the better Batting Runs Above Replacement (BRAR) line.

    Quick tangent, on that note: Rotating mediocre offensive players, whose total value comes from all-around play, through the DH role is a terrible idea. The DH exists to maximize offense. Omar Visquel, who posted +1.3 WAR in limited action (62 games) last season, will not translate into winning additional games if you play him at DH.

    You want a guy like Thome because all he can give you is batting and he does it quite well. As I mentioned before, it is one thing if you are someone who can play OF or 1B or whatever. If this be the case, then by all means, please use WAR to compare and contrast players. Here, you want the healthiest, most all-around contributing player. However, this is a DH-only situation for Jim Thome and any team looking to sign him is looking for a DH-only player to play only DH. In this situation, you need to look not at WAR, but BRAR, and note that a DH-only player is bound to have a more limited WAR than comparably good hitting non-DH-only players.

    Of all DH's who received 250+ PA's last year, only three (Adam Lind, Jason Kubel and Hideki Matsui) had WARs higher than Thome (who posted a +1.5 WAR mark as a DH for the Sox). Of those three, only Lind was worth +3 or more WAR (+3.7, to be exact). Additionally, all three of Lind, Kubel and Matsui received somewhere between 100 and 200 more PA's than Thome did in 2009.

    Thus, we cannot evaluate a DH from last season, who we are prospectively signing as DH for this season, and say "oh he's only an X WAR guy." Obviously the guy whose slightly good at defense and offense combined and plays a valuable position will be worth more in the field, but as a DH, it's about one thing and one thing only. What's your batting line? And Thome's is still good.

    __________________

    ADDENDUM: I would also here like to here quote an earlier post, as I feel this comment is quite relevant to this overall argument:
    "As a RF, Dunn's cumulative batting and fielding production gets a -7.5 positional adjustment (UZR measures all defense equally; Fangraphs accounts for differences in fielding difficulty between positions in WAR calculations thru positional adjustments). As a DH, Dunn would get a flat -17.5 positional adjustment and a zero fielding rating. In other words, as a DH, Dunn just get -17.5 runs subtracted from his batting line. As a RF (or LF, for that matter), Dunn gets -7.5 subtracted from his batting line in addition to his lackluster fielding. Thus Dunn, like anyone with a consistent -10 or worse fielding glove at RF/LF, belongs in a DH role."
    The same holds true for any 1B who plays with a -12.5 FRAR (Fielding Runs Above Replacement) or worse glove. They too, like the poor outfielder and frequently unhealthy slugger, belong in a DH-only role. The thing is, it's very hard to be that bad at first base...only Adam Dunn was at least that bad last season...

    Is Adam Dunn Underrated?

    Is Adam Dunn underrated? Yes, Adam Dunn strikes out a lot (almost 1/3 of the time), plays poor defense, makes minimal contact with baseballs (his career contact rate is 71.5%; the MLB average was 80.5% last season) and has a career batting average just under .250. Still, Adam Dunn has a career OPS above .900. He's walked 913 times in 5417 career PAs (16.9% walk rate, .383 career OBP). Dunn's averaged 39.3 home runs per season (and hit exactly 40 like clockwork from 2005-2008). His .276 ISO over the past 3 seasons is the sixth best mark in the majors, while his 118 HRs over that span are two more than Pujols' 116 and his 339 BB's are second to no one.

    And yet, Dunn struggled to find work last offseason when he became a free agent (he didn't officially sign with the Nationals until February 12). This should have come as no surprise to even the most casual Adam Dunn follower. Dusty Baker never appreciated his skill set and J.P. think he's a useless slacker. Heck, even Jason Varitek unintentionally took a shot at Big Donkey.

    But it is not as though nobody except his mother likes him. Sabermetric-minded fellows, ranging from the casual and hilarious to the serious and boring (just kidding, I absolutely love THT) have defended Dunn from every jab taken at him. Even we at Game Of Inches have defended the Big Donkey in the past.

    But is Adam Dunn underrated?

    True, Adam Dunn is a great offensive player (career .384 wOBA), but he's also an equally atrocious fielder, a fact this is often glossed over (as it was in the introductory paragraph to this post). Winning baseball games, if boiled down to the most simplistic mathematical formula, is a differential between Runs Created and Runs Allowed. A run gained with a bat is equally as valuable as the run prevented with the glove.

    It is with this maxim in mind that I point out the follow fact which probably eludes the casual Dunn fan: Adam Dunn has been a sub-3 WAR player since 2005. He's been a sub-2 WAR player in all of those seasons except 2007. Over the past two years, Dunn has cumulatively worth under 2.5 WAR. By contrast, B.J. Upton, Andy LaRoche, Miguel Tejada and even Paul Konerko were more valuable in 2009 than Dunn has been cumulatively over the past two seasons. Last season, despite creating 35.5 runs more than the average player with his bat, Dunn was a meager +1.2 WAR player thanks to the 36.3 runs his glove cost the Nationals. Omar Vizquel, who only played 62 games last year, was worth +1.2 WAR.

    Yeah, Adam Dunn is that bad at fielding.

    Fangraphs values Dunn's +1.2 WAR performances in 2008 and 2009 at just over $5 million in terms of free agency dollars. And yet, the world of baseball was shocked when Dunn was "only" able to sign a contract for 2-years, $20 million. Dunn was paid $8 million last season and is set to earn $12 million this season. Even if Dunn's fielding, which has been on the decline since 2004, is half as bad as it was this season, he will be, assuming that his offensive production remains steady, a +3ish WAR player. In terms of free agency dollars, a 3.0 WAR season would be worth approximately $13.5 million next season. If this is the case, then Dunn would have been "overpaid" by $1 million by the Nationals over the life of his contract -- not bad, essentially market value.

    So I beckon the same question again: is Adam Dunn really underrated? Or is he just so underrated that he has become overrated (or at least adequately rated)? What is clear is that Adam Dunn belongs in the AL, playing DH (where players get a -17.5 positional adjustment to their batting line, half of Dunn's negative fielding impact).

    __________________________

    Valuable Post Script:

    As a RF, Dunn's cumulative batting and fielding production gets a -7.5 positional adjustment (UZR measures all defense equally; Fangraphs accounts for differences in fielding difficulty between positions in WAR calculations thru positional adjustments). As a DH, Dunn would get a flat -17.5 positional adjustment and a zero fielding rating. In other words, as a DH, Dunn just get -17.5 runs subtracted from his batting line. As a RF (or LF, for that matter), Dunn gets -7.5 subtracted from his batting line in addition to his lackluster fielding. Thus Dunn, like anyone with a consistent -10 or worse fielding glove at RF/LF, belongs in a DH role.

    I'm placing a "Quintessential Sabermetrics Argument" tag on this post because it underlines the unheralded importance of fielding.

    The Quintessential Sabermetrics Argument: Batting Average (and Hits)

    If you believe in statistics, then you have undoubtedly encountered what I like to call "The Chris Rongey Quotient" (granted, in hindsight, arguing that Rios is a worse value than Nix was quite silly on my part -- still the underpinnng denial of Rongey that stats explain important things is fun to listen to). This set of humanity consists of people who have watched sports longer than you, know more about useless stats than you, may or may not work "in the industry," think Andre Dawson is better than Tim Raines and also ignore/insult all of that which disagrees with them. Such persons will constantly pester you with the same statements when you try and talk about sports intelligently: Who the hell is Billy Beane and why is his stupid book (which I've never read) so stupid? Stats are for people who live in their mother's basement. You can't score runs if you don't get any hits. You just made that stat up.

    Maybe you are not a stat-a-phobic person. Maybe you are just a person who wants to know "whats up." You like sports and want to learn more, but do not know where to begin.

    Whether you are the guy looking to shut Chris Rongey down or the guy who wants to learn more about basic sabermetrics, let this post and those that follow it (I am dubbing this series "The Quintessential Sabermetrics Argument") be your guiding light. We will begin with the basics (the quintessential truths, etc.) and then move towards their application.

    Lets get things started with a very basic topic: Batting Average (and Hits).

    To explain why batting average and hits are pointless "metrics" by which to measure a hitter's abilities and run scoring, we must consider first what is a hit. To put it most simplistically, a "hit" is a ball put into play which is not converted into an out. The question is not what is a hit, but why is it a hit, which illustrates the futility of the metric. Does the hitter truly earn his "hit?" In theory, yes. A ball smoked to the gap is clearly an "earned hit." But why was the hit earned? Where is this "gap?" Is it a fix position? No.

    A hit is simply this: a ball put into play that slips through the defensive positioning and ability of the fielders. Are either of these factors within the control of the hitter? No, not really. The difference between a double to the gap or a caught liner is simply "was the shift on?" A hit up the middle versus a double play can be a question of whether or not the shortstop was holding the runner at second on. The difference between a liner down the line and a caught ball is whether or not Ryan Howard was playing 1B or DH in an interleague game.

    Clearly the hitter controls or exercises some control over the direction of the ball and the strength of contact by "timing" and "squaring" the pitcher's offering, but once the ball is in play, whether or not that balls is a "hit" is almost entirely depending on the positioning and ability of the defense. The glaring exception to this rule, of course, is the home run. That is a "hit" truly and 100% earned, although fielders can even steal those sometimes.

    In short, hits are not something a player particularly controls. There is a lot of luck involved and over long enough sample sizes, luck tends to average out. It is not shocking, therefore, that over 162 games against 20 or so teams, a player's collective "balls in play" (BIP, non-HR balls put into play) which are converted into hits tend to fluctuate between a normative band of numbers (usually between .290 and .310, though any given player's BABIP varies based on his speed, types of contact (each of GB, FB, LD are differently correlated with BABIP), and strength of contact). Last season, the lowest BABIP a team had was .285 (the Reds) and the highest a collective team had was .326 (the Angels). Only four teams did not have a collective BABIP between .288 and .312 last season. The MLB average BABIP last season was .302.

    Thus, knowing that BABIPs tend to normalize (in aggregate towards .300 and individually towards a player's expected BABIP and that hits are mostly defendant on BIP averages, it is not so difficult to conclude that hits are a poor measure of a hitter's ability -- if for no other reason than a hit is more in the fielder's control than that of the hitter.

    Is batting average also a poor metric by which to measure a player and team's ability to score runs? I will pretend that you answer my rhetorical question by stating "of course it isn't, that's why we have RBIs" because 1) runners being on is situational and independent of a hitter's ability, 2) the normalizing effects of BIP do not cease effect in high leverage (clutch) situations, and 3) clutchiness really does not exist (read the link for more info on why).

    To answer my question, I posed another question: how does one score runs? Scoring runs is accomplished by a two-step process: putting runners on and moving them over. Putting a runner on base is measured by On Base Percentage (OBP), which accounts for both hits and walks. Hits are largely a function of luck and regression towards some mean over time, while walking is more of a static skill (a player's ability to read the strike zone and determine a pitch's trajectory is not as dependant on outside factors other than an umpire's [in]ability to call balls and strikes). Moving the runner over is measured by the hitter's power, or ISO (Slugging Percentage (SLG) minus Batting Average (AVG)). A double will move a player over more bases than a single and a triple more than a double, while a home run will clear the bases and score the batter. The higher a player's power, the higher his SLG. Because SLG is measured as ((1B)+(2*2B)+(3*3B)+(4*HR))/(AB), a player with absolutely no power (hits only singles) would have a SLG of 1B/AB, where H (hits) would be equal to 1B. Thus, a player with no power's SLG would be equal to his AVG (AVG=H/AB). As a player has more power, his SLG becomes larger than his BA. This is why a player's power is measured by ISO.

    Where, I dare ask you, is "hits" a component of this runs-scoring model? It exists, hidden away in getting on base and to some extent moving the runner over, but the "ability to get more hits than the average guy" component of the game that most people attend to when they say "he's a good hitter" is more noise than evaluation. " AVG, though not entirely useless, is a misleading and inefficient metric by which to measure runs scoring ability. It's a part of the equation, but it is a misnomer to point to batting average as a point of leverage in the equation. The best metrics which account for runs scoring are OBP (which encapsulates AVG (which does account for 50-65% of OBP)) and ISO.

    Any questions?