Showing posts with label The Hardball Times. Show all posts

On The Derby: DME's ESPN Radio Appearance

In case you missed it, earlier today I was on ESPN Radio discussing the Home Run Derby. You can listen to the audio by clicking here (you can hear a better audio quality here, albeit only the first 8 minutes). The audio is a bit soft, so you will likely to need headphones, but there is a lot of good chatter, so it is totally worth it. Thank you Paul Singman for recording this for me.

Hope you enjoy my ramblings. Below are a few of my specific liner notes of interest.

Open or closed roof?
  • A 10-degree change in temperature tends to have a 1% or so effect on flyball distance, and every 10 degrees over 70 tends to bolster park factors by 2.6 points.
  • The average MLB home run is about 395 feet, so each ten-degree change likely has a 4-5 foot effect on home run distance.
  • The projected temperature at Chase Field tonight is 95, versus somewhere in the mid-70s or so if they close the roof and air-condition the park. The forecast for tonight in Arizona is thunderstorms, so the roof will probably be closed. Given the heat/humidity, odds are the roof would have been closed even if the forecast was sans storms.
  • A closed roof could chop off up to 10 feet from tonights’ flyball distances compared to an open roof, making those “just enough” homers harder to attain, and those Slammin' Sammy/Josh Hamilton bombs unlikely.
  • Wind can also affect flyball distance, so a closed roof might also further affect flyball distance beyond just temperature.

Derby Players' Vegas Odds [per BoDog]
  • Jose Bautista: 3/1
  • Prince Fielder: 15/4
  • David Ortiz: 9/2
  • Matt Holliday: 9/2
  • Adrian Gonzalez: 11/2
  • Matt Kemp: 15/2
  • Robinson Cano: 15/2
  • Rickie Weeks: 12/1
Matt Kemp, as mentioned in the comments to my original article, would be my best "gambling pick" (looking at not just likelihood of winning, but also payout potential) for the derby, though I would call any attempt to gamble on as random an event as the Derby ill advised (hitting slow meatballs is hardly the same as hitting a fastball, let alone guessing what pitch at what speed is incoming). With three, Kemp has the most home runs over 440 feet of any derby contestant this year. Kemp's three are second in the majors only to Justin Upton, an Arizona Diamondback, who has four (each of which are over 450 feet)

Final note: Jonny Venters is the NL’s secret weapon this year. A lefty who gets strikeouts and tons of grounders (over 75 percent groundball rate this year) is going to be the key to getting out of a high-leverage jam. Craig Kimbrell is equally as filthy a pitcher from the right side, a testament to just how disgusting the Braves bullpen is. Imagine if Billy Wagner didn’t retire.

Javier Vazquez: Second half breakout candidate

The following is my latest article for The Hardball Times.

All stats current through July 7.

Javier Vazquez | Marlins | SP | 25 percent Yahoo ownership
YTD: 5.64 ERA, 1.56 WHIP, 6.25 K/9, 1.82 K/BB, 32.2% GB%
Oliver ROS: 4.29 ERA, 1.33 WHIP, 7.7 K/9, 2.75 K/BB


What a fall from grace Javier Vazquez's steep and sudden decline has been. A notorious and perpetual sabermetric darling for his career, the prototype for Ricky Nolasco always put up great peripherals that never seems to match his surface stats. Some, if not most, of the gap may have been ballpark and defensive effects, however.

From 2004 to 2008, Vazquez, a flyball pitcher by trade, played in some pretty offense-inflating and home run-inflating ball parks in front of some of baseball's poorest defenses. In 2004, he played for the Yankees, who collectively posted a major league-worst team UZR total of -75.9 runs.

The 2005 season was no different, as Vazquez pitched for the third-worst defensive team in baseball, the Diamondbacks, whose -48.8 team UZR hardly offset the environmental effects of a park that used to bolster offense much more half a decade ago than it does now.

And then, of course, Vazquez famously pitched for the White Sox at US Cellular Field, one of baseball's most home run-inflating ballparks, between 2006 and 2008 before the team traded him away for Tyler Flowers and Brent Lillibridge. (Hey, at least it's more than what they got when selling Nick Swisher, who they gave up Gio Gonzalez (again) to acquire).

Though Vazquez had a solid season of results for the Sox in 2007 (15 wins, 3.74 ERA, 1.14 WHIP, 213 strikeouts over 216.2 innings pitched), his results overall were largely poor (627 innings of league-average 4.40 ERA baseball) and "unclutch" (-3.80 Clutch rating between 2006 and 2008).

Vazquez's tenure on the White Sox only saw his bad-park, bad-defense meme continue. From 2006 to 2008, perhaps largely because of Jermaine Dye (aka "Life To Flying Things"), the White Sox's -80.5 cumulative team UZR ranked fifth-worst in baseball ahead of only the Yankees, Dodgers, Diamondbacks, and Pirates.

Regardless of the results, from 2004 to 2008 Javier Vazquez's underlying peripheral performance remained strong and ranked well amongst his peers. Not only did his peripherals indicate a better-than-his-results pitcher, but Vazquez was also one of baseball's most durable.

From 2004 to 2008, Vazquez's innings pitched total of 1041.1 ranked ninth overall amongst all pitchers who played at least one game during that span. Only Johan Santana (currently on the DL), Brandon Webb (currently on the DL), Roy Oswalt (currently on the DL), Mark Buehrle, Livan Hernandez, CC Sabathia, Jon Garland (currently on the DL), and Carlos Zambrano (currently on the DL) pitched more innings during that span.

Over those 1041.1 innings, Vazquez punched out 939 batters while only walking 273, for an elite strikeout-to-walk ratio of 3.44 (2.00 MLB average). Amongst the 153 pitchers to toss 400 or more innings between 2004 and 2008, Vazquez's 21.4 percent strikeout rate (16.7 percent MLB average) and 8.12 K/9 rate both ranked 18th overall, while his 6.2 percent walk rate (7.6 percent MLB average) was the 29th lowest. His 1.26 WHIP was also 26th-best in the majors.

Despite posting the 34th-worst groundball rate (39.6 percent) amongst this sample of pitchers, Vazquez's nonetheless owned the 27th-lowest xFIP (3.85 xFIP, 87 xFIP-) of those 153 pitchers.

In 2009, then, perhaps it should come as no surprise that Vazquez was one of baseball's best pitchers. Not only did he move from the DH-laden American League to the senior circuit, a move that tends to cause a pitcher's K/9 rate to spike by +0.57, and his ERA to decrease by approximately 0.41, but for the first time in his career, Vazquez was pitching in a offense-neutral park that slightly suppressed home run production in front of a middle-of-the-league defensive team.

As might be expected, Vazquez had a career year, producing a career-best 9.77 K/9 rate, a career second-best 1.81 BB/9 rate, and a career-best xFIP and FIP (both 2.77) that were only slightly below his career-best ERA of 2.87. Vazquez rewarded fantasy owners with 15 wins and career-best 1.03 WHIP.

Among the 130 pitchers who threw 100 or more innings in 2009, no one posted a lower xFIP than Vazquez, not even Cy Young winner Tim Lincecum, whose 2.83 xFIP was the only other xFIP in baseball below 3.00 that season. Vazquez's 9.77 K/9 rate ranked sixth-best in the majors amongst all pitchers with 100 innings in 2009, his walk rate was eighth-best, and his 5.41 K/BB ratio was second only to demi-gods Roy Halladay (5.94) and Dan Haren (5.87).

Not to humble brag, but as someone who drafted Yovani Gallardo, Dan Haren, and Vazquez that season (not to mention acquiring Zack Greinke in early April), you can imagine my productive year in fantasy. Alas, I digress.

Not only was Vazquez a great pitcher in 2009, but his 219.1 innings (32 starts) that year continued his legacy of durability. That year marked his 10th consecutive season of 32 or more starts, averaging 216 innings per campaign over that span and failing to top the 200 innings mark only once with a "mere" 198 innings in 2004.

Though 34 years old entering the 2010 season, few, if any, pitchers seemed more durable with better stuffs—especially on the free agent market—and the Yankees took notice. They shipped off quality starting pitching prospect Arodys Vizcaino (and Melky Cabrera) to the Braves in order to give Vazquez a second-chance at proving New York and the AL East was not "too tough" a place for him to pitch.

Vazquez's flyball tendencies and New Yankee Stadium's first year home run-happy exhibition indicated that Vazquez was unlikely to duplicate his 2009 success for New York's Bronx Bombers in 2010, but a strikeout rate above eight batters per nine, a sub-4.00 ERA, and top-notch K/BB ratio were to nonetheless be expected. No one could have predicted what happened next, as the wheels to came off—fast. Even Andruw Jones' meteoric fall from grace took a couple of seasons to occur.

Not only did Vazquez's move from the NL back to the AL—and from Turner Field to New Yankee Stadium—cause some regression, but Vazquez completely came apart as a pitcher. His average fastball velocity, which consistently sat between 91.1 MPH and 91.8 MPH from 2005-2009, plummeted to 88.7 MPH in 2010. In only one start, in fact, did Vazquez's fastball even average 90.

Fastball velocity is highly correlated to strikeout rates, ERA, FIP, and batting averages against, so perhaps Vazquez's loss of 2.5 MPH of stink off his cheese (food metaphor!) explains his then-career-low 6.92 K/9 and career-worst FIP/xFIP marks. However, walk rates are not very affected by changes in velocity, so there must have been something else at play, perhaps a hidden injury (Vazquez ultimately did spend time on the DL in 2010) if we are to explain a career-high 3.72 BB/9.

At the least, with a 5.64 ERA and 1.40 WHIP over a near career-low 157.1 innings, the Yankees did not get what they bargained for by giving up Vizcaino. So they let him walk and wisely did not offer arbitration.

Now there were several teams out there this preseason willing to give Vazquez another chance, given his history, on various one- or two-year deals. Dave Cameron showed us that history indicated it was unlikely for Vazquez's fastball zip to return, and that perhaps we all underestimated the wear-and-tear that over 42,000 pitches and 2,647.1 innings had taken on Vazquez's arm over 13 seasons.

Nonetheless, despite all the red flags, the Marlins were willing to give Vazquez—who wanted to rebuild his stock and felt comfortably familiar with the Marlins organization—a flier on a one-year, $7 million deal that was reportedly lower in both years and money than what other teams were willing to pay.

That history brings us to this season, where Vazquez has produced a 5.64 ERA, a career-worst 1.56 WHIP, and 4.62 xFIP to date in an era where the league average pitcher has an ERA, FIP, and xFIP all in the high threes. This investment has hardly paid off thus far for the Marlins, as Vazquez's strikeout rate (6.25 K/9) has continued to decline, while his walk rate (3.43 BB/9) remains inflated.

Despite all this ugliness and recent history, however, there are several reasons for the Marlins and frugal fantasy owners to find solace in Vazquez in the second half.

First and foremost, Vazquez's velocity (2011 average to date is 89.5 MPH), which is still down below his career rate of 90.9 MPH and his 2005-2009 velocity range, is up from last year. More importantly, however, his fastball velocity has been averaging in the low 90's his past five outings. Recent fastball velocity tends to become relevant and reliable very quickly (after about three outings), so this could be a great sign for Vazquez the rest of the way.

In addition to a rekindled fastball of late, Vazquez also has rediscovered his control over his past 10 outings. Since May 9, Vazquez has tossed 54 innings and only walked 12 batters (and of those 12, only 10 were unintentional) for a walks-per-nine rate of 2.00 on the button. Meanwhile, Vazquez has punched out 46 batter (7.67 K/9) for a 3.83 K/BB rate that accords with Vazquez's 2004-2009 performance.

While walk rates take approximately a year and a half to stabilize, unintentional walk (half a season) and strikeout rates (one-fifth a season) stabilize much faster. Vazquez's full season unintentional walk rate of 2.92 this season is not too far off his career rate of 2.55, and a substantial improvement over last year's disaster rate of 3.89.

Vazquez remains an unashamed flyball pitcher this season (32.2 percent groundball percentage in 2011, 34.9 percent in past 10 years), but if we plug his past 10 starts worth of data into the latest version of the xWHIP Calculator, calibrated to the 2011 run environment, we get a good picture of the quality of his recent performance:

image

Noting that the eFIP and xWHIP league averages are approximately 4.00 and 1.33, respectively, it is clear that Vazquez has performed substantially more like his former self of late than his season ERA/WHIP or even past 10 starts ERA/WHIP (4.83/1.35) indicate.

Vazquez may not be one of baseball's thirty best pitchers anymore, and thus no longer an ace, but if he can continue his recent performance, a sub-4.00 ERA and strong WHIP with good strikeout totals could be in the cards. And if Hanley Ramirezcontinues to play like his former self as he has of late (past 12 games: 16-for-45, five walks, three HR, one SB, 12 RBI, nine runs), then a healthy wins total could also be coming for the disgraced starter.

Unless you are in a deep (14-plus teams) or NL-only league, chances are that Vazquez is available for free (or a $1 FAAB bid) in your league's free agency pool. While I cannot recommend starting him just yet, he is certainly worth the pickup for your bench and worthy of the type of monitoring that would require a compelling government interest.

Vazquez is likely a matchups-only play at the moment (though it is worth noting that most of his recent ten outings came against offense-heavy teams), but is equally as rosterable as, if not more so than, Rich Harden.

Keep a close eye on Vazquez after the All-Star break. He could be a second-half Josh Beckett- or Bartolo Colon-like value.

Recommendation: Javier Vazquez should be owned in NL-only leagues and at least bench-owned in 12-plus-team mixed leagues. Ten-team mixed leagues can ignore Vazquez for now, but should monitor his next five starts closely.

As always, leave the love/hate in the comments below.

HR/OFFB% Park Factors

The following comes from my latest post on The Hardball Times. Because of the width of our site, to get 4-year home run per FLYBALL park factors, you'll have to go to my above link to THT.

A couple of years ago, former THT writer Dan Turkenkopf tabulated an index of single-season (2009) and four-year home run per fly ball (HR/FB) park factors. I have griped plenty about using HR/FB rates over home run per outfield fly ball (HR/OFFB) rates in tabulating xFIP many times in the past, most recently last week, because HR/FB rates include pop-ups (IFFB), which can never be home runs. The data, over large samples, may be insignificant in difference overall, but why use bad data and skew the margins? It's like Fangraphs' incomprehensible decision to use strikeouts per at-bat (K/AB) instead of strikeouts per plate appearance (K/PA) to calculate strikeout percentage*. (Dave Cameron has indicated that recalibrating Fangraphs' database would likely be a cumbersome process.)

*Here are two examples why Fangraphs' K% calculations, done as K/AB, make no sense. First, assume player X has a particular K/PA in year N. In year N+1, he maintains the same K/PA rate, but increases his walk rate. Though his K/PA remains stable, Fangraphs would report his K% as having "increased," imparting negative stigma and poor analysis by persons who are not aware that K%, not on the same scale as BB% (calculated as BB/PA), does not per se indicate actual strikeout skill. Likewise, players with higher walk rates exhibit disproportionately high strikeout rates.

Ryan Howard, for example, has a career K% of 31.9 percent on Fangraphs, but has only struck out in 27.5 percent of his total plate appearances. For Howard, who strikes out a lot, this may not matter or make much of a difference if you analyze him, but for a player like Prince Fielder (career 22.1 percent K%), it does. Fielder has struck out in only 18.6 percent of his total plate appearances. On the surface, it would seem as though Brennan Boesch (20.4 percent K%) and Ryan Braun (20.5 percent K%) are "noticeably" better at avoiding strike three, but are in reality substantially the same, owning respective K/PA rates of 18.1 and 18.4 percent for their careers.

Other high walk "strikeout" sluggers, such as Geovany Soto, have K/PA rates that are lower than low-walk players with lower K% rates. Some say "well you can't strike out in a walk, so why use plate appearances in the denominator," but you also can't strike out in a hit or walk in a strikeout, and yet we accept plate appearances as the denominator for walk rate (BB%). Plus, just logically, shouldn't K% represent how likely a player is to strike out when he comes to the plate? Why make Shin-Shoo Choo's year-to-year K% like comparing apples to oranges because of a fluctuating walk rate?


Particularly where your data has an abnormal pop-up rate, HR/FB-tabulated xFIP loses a lot of its value. In fields like Oakland where there is a lot of foul territory, and in parks like Wrigley, where there is practically none, the differences in HR/FB and HR/OFFB rates might make a difference. The difference may be a couple of home runs at most (park factors only apply, in theory, in a half-step, as a player's expected number of home games is just 50 percent), but in a game of inches, such could affect Z-Scores, data distribution, etc. If memory served, HR/OFFB has also shown to be less volatile year-to-year than HR/FB.

Because I have such a penchant for HR/OFFB-based calculations, including them as a data point in my xWHIP Calculator, I asked a favor of Dan, who has in turn tabulated an index of HR/OFFB rates by ballpark using data from 2006-2009. We did not have the necessary 2010 data offhand to tabulate 2007-2010 rates, but hopefully this offseason we will be able to plug in 2008-2011 data for a fresher version of these numbers.

As with Dan's 2009 post on HR/FB park factors, certain parks have less data, are weighted similarly (but without the same old data to affect the weights), and may not be as reliable. The data below regards old Twins Stadium (the Metrodome), while the Mets' and the Yankees' Park Factors are from one season only. The Nationals' Park Factor also only uses two seasons worth of data, and is weighted at 5 and 3. All other parks feature four-year weighed factors of 5,3,2,1.

Without further ado, here is the goldmine of data you've probably always wanted, but never had (at least not that I was aware of) until now, ranked from most-to-least home run inflating per outfield fly:
Team              Park                         LG    4-Year HR/OFFB
Yankees New Yankee Stadium AL 120
Reds Great American Ballpark NL 116
Rays Tropicana Field AL 114
Orioles Oriole Park at Camden Yards AL 113
White Sox US Cellular Field AL 113
Rockies Coors Field NL 111
Astros Minute Maid Park NL 110
Brewers Miller Park NL 108
Marlins Dolphins Stadium NL 108
Blue Jays Rogers Centre AL 107
Cubs Wrigley Field NL 104
Mets Citi Field NL 104
Angels Angel Stadium AL 102
Diamondbacks Chase Field NL 100
Rangers The Ballpark at Arlington AL 98
Giants Pacific Bell Park NL 97
Red Sox Fenway Park AL 97
Tigers Comerica Park AL 96
Phillies Citizens Bank Park NL 93
Pirates PNC Park NL 93
Athletics McAfee Colisuem AL 92
Dodgers Dodger Stadium NL 92
Mariners Safeco Park AL 92
Braves Turner Field NL 91
Nationals Nationals Stadium NL 91
Twins Metrodome AL 88
Indians Jacobs Field AL 87
Royals Kaufman Stadium AL 86
Padres PETCO Park NL 79
Cardinals Busch Stadium NL 76


Thanks again to Dan Turkenkopf for crunching the numbers for me. As always, leave the love/hate in the comments below.

Disproving The Myth Of Dan Haren

The following is my latest article for The Hardball Times, and another entry in a long series of posts about my man crush on fantasy ace Dan Haren.

All stats are current through June 14.

There are many popular memes about "partial-season" players in baseball. Adam LaRoche and Mark Teixeira can't hit in the first half. Kosuke Fukudome can only hit in April, while CC Sabathia can't pitch in April. And, of course, the one that inspired this writing, the notion, largely perpetuated by Matthew Berry and the folks at ESPN, that Dan Haren can't pitch after the All-Star break.

Some of these myths have some result-based credence to them (Teixeira, for instance, has a career slash line of .237/.348/.427 in April (.775 OPS), whereas his career OPS marks in May, June, July, August and September are all above .900), but do they, particularly the Haren one, have "predictive" substance behind them?

First, let's look at the pitcher Haren has been for his career. In short, he has been about as consistent and elite a pitcher as there is. Over the course of his eight-plus years in the major leagues (2011 is his ninth), Haren has proven to be very durable—pitching 216 or more innings each of the past six years, and on pace to do so again this year—and has compiled a 3.59 ERA and 1.18 WHIP along with 1338 strikeouts to only 339 walks over 1561 major league innings.

On the peripheral level, the surface checks out, as validated by a 3.60 FIP, a 3.55 xFIP, a 3.84 tERA (this tends to be a higher figure than FIP, though scaled to look like ERA), and a strong strikeout rate (20.7 percent K rate versus an 18.0 percent MLB average) that comes from the ability to induce a good number of swings-and-misses (career 9.7 percent swinging strike percentage, MLB average is 8.4 percent).

Even his batted-ball normalized numbers check out, as Haren's expected WHIP and eFIP check in at superior rates of 1.23 and 3.69, respectively.

Haren is also a relatively neutral batted ball-type pitcher (career 1.20 GB/FB ratio, 0.78 GB/AO ratio) who has played in relatively neutral home run-inflating parks (Angel Stadium, with a home run-per-outfield fly ball (HR/OFFB) park index of 102, is the most home run-inflating park of his career), though he has never experienced any type of home run luck (career 11.5 percent HR/OFFB percentage, 11.3 percent MLB average).

As a flyball-neutral pitcher with good strikeout rates and low walk rates, there are very few, if any, holes in Haren's game. More inspiring, however, is Haren's consistency. Since his breakout year in 2007, Haren's relative ERA indicies have been as follow: 138, 139, 142, 106*, 148.

*Though Haren's BABIP-inflated first half ERA+ was 93, his second-half ERA index was 139.

All in all, with Haren, what you see is what you get, and you tend to get what you paid for.

In Roto leagues, full-season expectations are everything, but in H2H leagues, or micromanaged Rotisserie leagues, splits are important. As any Alex Rios owners last year can tell you, as much value as a player puts for in the first half, irrespective of his end-of-season line, if his second half is nerve-wrecking, not only can he make you forget all the good he did for you, but a front-loaded player can cause you to nose-dive from the top of your league's standings.

Noting how great Haren's end-of-season statistics have been over the past half-decade of baseball, let's investigate whether or not he truly is one of these "front-loaded" players you need to deal rather than hold.

First, the results. Per Baseball Reference, Haren's second-half results have not been up to par with his first-half surface stats. Though Haren is the owner of a robust 3.21 ERA and 1.09 WHIP with 751 strikeouts to 181 walks (4.15 K/BB ratio) over 880 innings pitched in the first half for his career, his career second-half numbers clock in at a 4.07 ERA and a 1.30 WHIP with an equally good 7.8 K/9 ratio (587 strikeouts over 680.1 innings pitched), but more walks (158, for a 3.72 K/BB ratio).

Now, a 4.07 ERA and 3.72 K/BB is not horrible (keep in mind the league-average ERA and K/BB over this period were approximately 4.40 and 2.00, respectively) nor something to sneeze at, but in light of his career end-of-season numbers and stellar first-half numbers, you can understand why owners generally want to sell Haren by July.

But is this "sell, sell, sell" attitude particularly warranted, despite the results? Or does it breed a market inefficiency that you can exploit to your advantage? Because we at The Hardball Times are bigger fans of inner, rather than outer, beauty, let's dig a little deeper into Haren's first- and second-half splits; beyond the results, and into the process.

Based on the FIP formula, Haren's first- and second-half splits are a lot less extreme than they seem by ERA standards (0.86 points). Though Haren tends to walk a few more batters in the second half (4.4 percent uBB versus 3.9 percent), his second-half FIP (3.70) is only 0.40 points above his first-half FIP (3.30). This split is less than half as severe as his ERA split, and relative to his career FIP (3.60), it is not too far apart from what you are paying for.

Digging further, we also find that Haren's second-half batted ball profile indicates that he tends to give up fewer fly balls and more ground balls in the second half compared to the first half. Whereas Haren's career first-half flyball rate is 38.8 percent, his second half rate is 34.4 percent.

In fact, if we calculate Haren's "exFIP" (exFIP is xFIP calculated with HR/OFFB in place of HR/FB, done because a popup can never be a home run) we find the split even tinier, with a 3.35 first-half exFIP and 3.63 second-half exFIP. Haren's expected WHIP splits between his first and second half are even smaller.

So, while it is clear that Haren has been a better pitcher in the first half for his career, his peripherals say that the talent splits between the first and second half for Haren are relatively marginal. Pitchers tend to wear down over the course of a 162-game season, and the cold April weather warms up by July, so I was not be shocked to find that second-half league ERAs tend to be higher than first-half ERAs.

In 2009, for example, the first-half league ERA was 4.09, while the MLB average ERA was 4.57 in the second half. The same was true in 2008 (4.19 versus 4.52) and 2007 (4.36 versus 4.61). 2010 was a different story (4.16 versus 3.98), but the second half of last season marked the beginning of the "new era of the pitcher" everyone loves to write about. In 2010, in fact (and ironically), Haren's first-half ERA (4.60) was higher than his second-half mark (2.87).

So why the major ERA split for Haren?

For one thing, Haren has always been a bit lucky with balls in play during the first half, while the opposite can be said of his second halves. For his career, Haren's first-half BABIP is .274, while his second-half BABIP is .318. His cumulative career BABIP is .291.

In addition to BABIP, Haren has seen more of his fly balls leave the yard in the second half than in the first half. Whereas Haren has a HR/FB rate in the high-nines for his first-half career, that number is close to 11 percent in the second half (10.5 percent MLB average). That is not too surprising, as every 10 degree increase in temperature tends to boost flyball distance by a couple percent.

So what does this mean?

If you currently own Haren, it means do not panic. You own one of baseball's most elite pitchers, and there is no real reason to sell him, especially at a discount, to try to poach a pitcher who is not a "second half dud."

Haren currently owns a 2.54 ERA and 0.98 WHIP. His peripherals says that, as always, he's earned those numbers. Though Haren is no longer pitching in the NL and, as could be expected, striking out about a half-batter fewer per nine innings, he is currently inducing ground balls and popups at career-best or second-best rates.

He owns a 2.51 FIP, and a 2.99 xFIP that is 35 percent better than the rest of the league. Even xWHIP's more-inflated numbers love Haren, claiming his performance to date to be worth a 3.26 eFIP (4.00 MLB mean, compared to a 3.80 MLB mean for xFIP) and a 1.12 WHIP (top 15 among all major league pitchers, including relievers, with at least one game started).

Haren is not someone to trade away unless you get someone just as good in return, and that's not an easy standard to meet, even in the rekindled era of the pitcher.

If you do not currently own Haren, it means you should exploit the myth that Haren can't pitch in the second half. The myth does not mean you can get Haren for Zach Britton, but it does mean you might be able to trade away a "lesser" pitcher like Matt Garza, Josh Beckett, Mat Latos, or Anibal Sanchez as the substantial majority piece (if not a one-for-one deal) in a deal to get him.

You also might be able to swap out ceiling and risk for reliability, moving Josh Johnson as the All-Star break (and his alleged return from the disabled list) approaches. You might also be able to get Haren plus a useable fantasy piece for your team in what should otherwise be a one-for-one deal (e.g., trading Sabathia for Haren plus something).

Either way, you want Dan Haren on your team in the second half.

Making sense of xWHIP through the power of relativity

The following is my latest article for The Hardball Times.

Before reading this article, I encourage you to read my earlier xWHIP and eFIP; this is an extension of the data presented from it. All statistics are current through May 27.

Earlier this week, I presented an updated form of my xWHIP Calculator, which, with the power of normalization, calculates a pitcher's expected hits and expected innings based on his batted ball profile. In raw form, I presented various data points for both xWHIP and eFIP. While useful, such absolutes can be hard to interpret. What does a 1.16 xWHIP mean in isolation? Particularly with the low variance in WHIP in baseball (the range tends to be largely between 1.10 and 1.50), small differences in WHIP can make a larger difference than you might think.

To address these problems, I have calculated each player's xWHIP Z-Score to give some sense of relativity. Because we are dealing with pitchers, where lower is better, I calculated the data so that the lowest Z-Scores equate the best impact players, while higher Z-Scores indicate the worst players with the biggest impact. I also tabulated a column of weighted Z-Scores scaled to expected innings pitched through May 27. This will give you some sense of which players should, in theory, have had the biggest impact on WHIP through the first two months of the season.

Because this column is weighted based on expected innings to date, which may vary in the future based on past playing time, it should not necessarily be consulted in evaluating a player's prospects (e.g., Zack Greinke has the highest Z-Score at -1.98, but only a -1.22 weighted score due to his limited number of relative starts to begin the season). For future value, you should consult the player's unweighted Z-Score, which should be scaled based on relative expected future innings. For example, if pitcher A is expected to pitch 20 percent more innings than the average full-time starter for the rest of the season, his Z-Score should be adjusted accordingly.

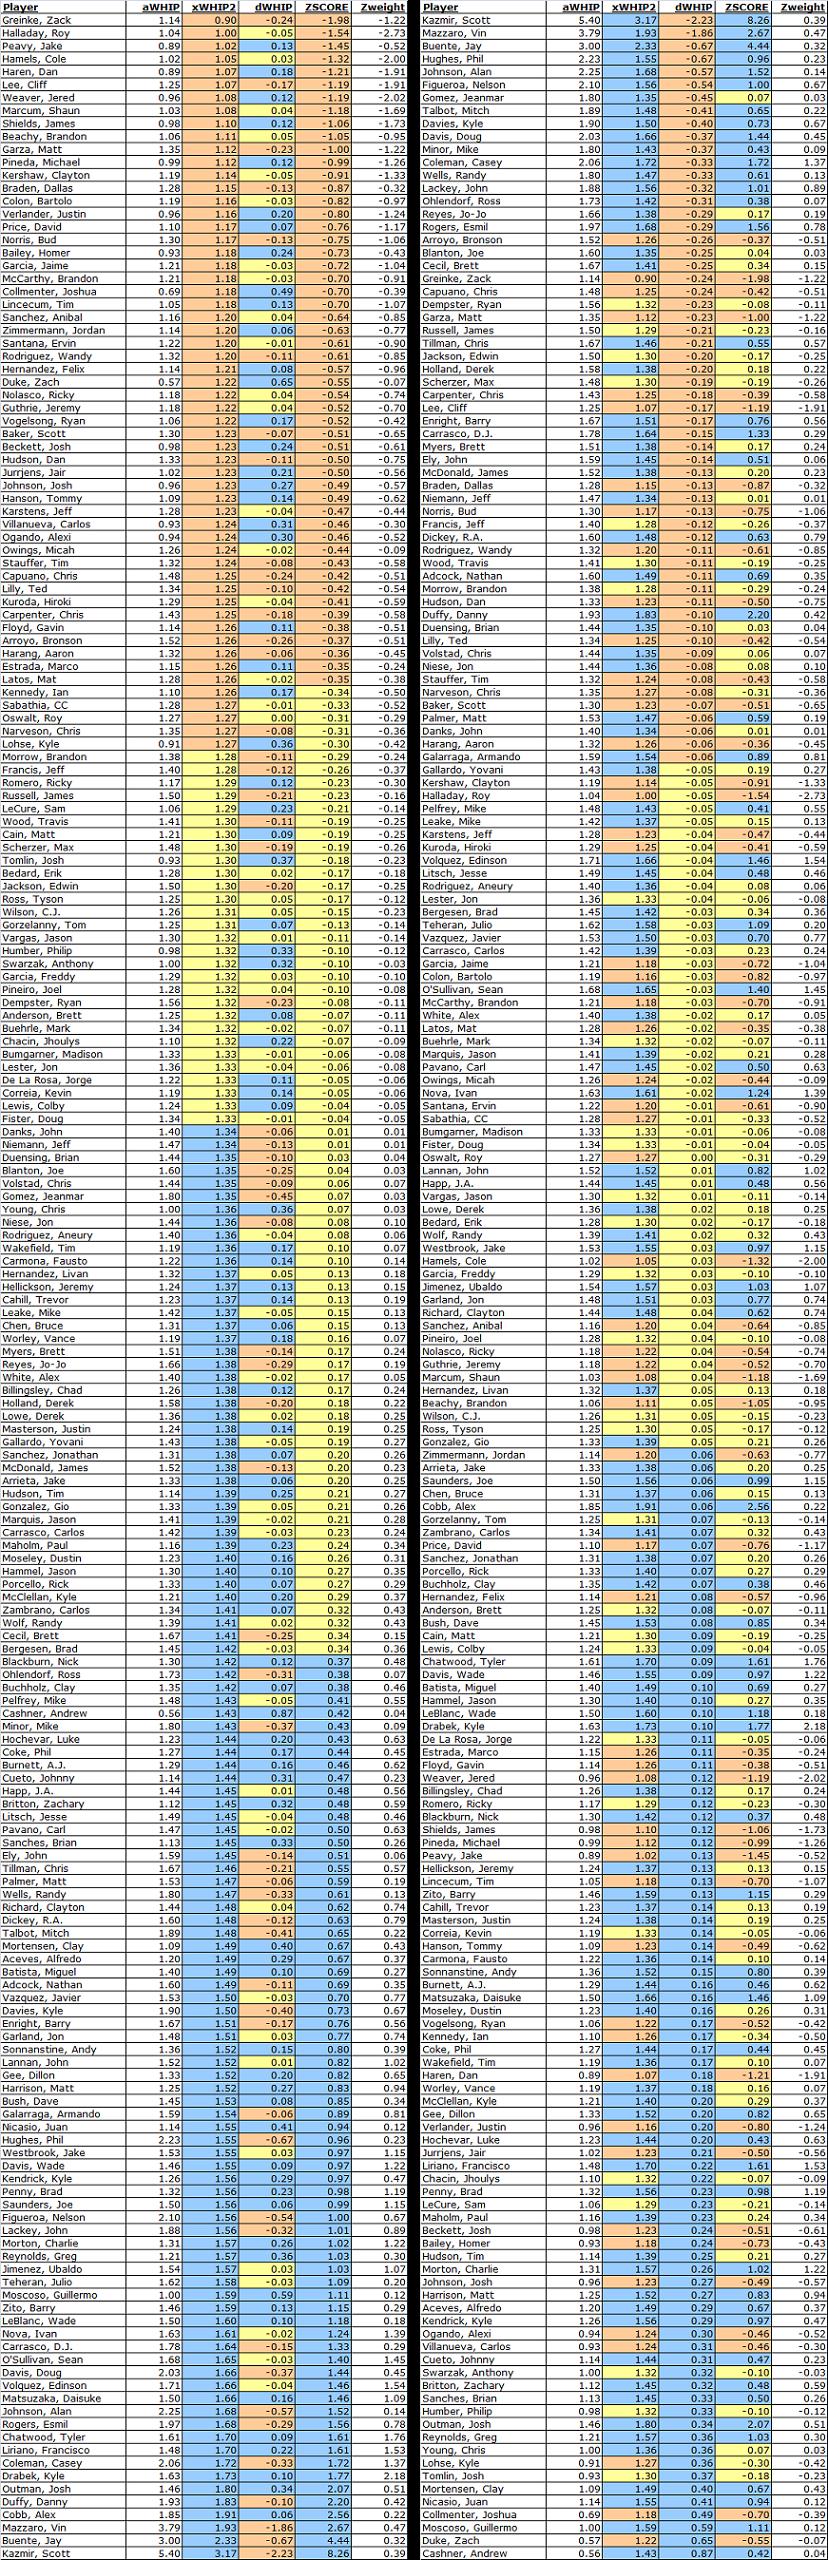
To make the data easier to interpret, particularly because I am using Z-Scores in lieu of an index (this was done because of pitcher clustering; the Z-Score calculations give a better sense of impact and relativity for xWHIP), I color-coordinated the data below.

Orange cells mean that the pitcher is in the upper echelon of the relevant column. For xWHIP, this means the pitcher has an xWHIP below 1.27. For dWHIP (the difference between actual WHIP and xWHIP), this means that the pitcher's xWHIP is at least 0.05 points lower than his actual WHIP to date. For Z-Scores, it means the pitcher has an xWHIP Z-Score of -0.35 or lower. These are likely pitchers to target for acquisition, particularly if one or more of his xWHIP, dWHIP, or Z-Score is colored orange.

Blue cells mean that the pitcher is in the lower tier of the relevant column. For xWHIP, this means the pitcher has an xWHIP of or above 1.34. For dWHIP, this means that the pitcher's xWHIP is at least 0.05 points higher than his actual WHIP to date. For Z-Scores, it means the pitcher has a Z-Score of +0.35 or above. These are likely pitchers to avoid or trade, particularly if one or more of his xWHIP, dWHIP, or Z-Score is colored blue.

Yellow cells are "neutral." These are players who are unlikely to have any significant impact on your team's future WHIP, for better or worse. The xWHIP threshold for neutrality is 1.27 to 1.33. I chose 1.27 as the lower end of the xWHIP threshold, despite the fact that the league average xWHIP is 1.33, because the sample of fantasy players in use is a subset of the starting pitching population. The worst pitchers in the league are unlikely to be on a fantasy roster, and at the same time are likely to post the highest WHIPs. In my preseason E.Y.E.S. post about how to calculate auction values, I tabulated the league average fantasy player's WHIP at 1.265. Because starters tend to have a higher WHIPs than relievers on average (expected mean starter WHIP was 1.30), I am using 1.27 as the lower bound of neutrality.

That all noted, here is a visually organized presentation of the data. The left set of data is organized by xWHIP, while the right set of data is organized by dWHIP (you'll need to click the image to enlarge it):


As always, leave the love/hate in the comments below.

xWHIP and eFIP

The following comes from my latest article on The Hardball Times. All statistics are current through May 27, 2011.

Sabermetricians have shown that once the ball is out of the hands of the pitcher, the pitcher has very little control over the outcome of the ball put into play.

DIPS theory tells us that a pitcher controls a few things about the outcome of an at-bat, each to a variable degree. The pitcher has the most control over the elements of the game that only involve himself, and omit others. A pitcher is in almost absolute control over the general location of his pitch. There are some marginal or unpredictable variants such as temperature, weather, wind speed and wind direction that factor into pitch location, but a pitcher who does not hit his spots can generally only blame himself. He either gripped the ball incorrectly, released it too late, did not properly adjust his throw for weather condition, "has the jitters," just can't pitch, etc. A pitcher likewise almost completely (though less completely than location) controls intentional walks, which essentially eliminate the batter from the equation of the outcome. Though players like Miguel Cabrera and Jeff Francouer come to mind as the rare player who interferes with the pitcher's attempt to intentionally walk them, it is generally true that if a pitcher wants to intentionally walk a batter, it will happen.

Once the batter comes into the equation, the pitcher loses his control over the outcome. Once the pitch is released from his hands, he has done all he can do. It is then in the batter's hand as to whether contact is made, where on the ball the contact is made, how hard the ball is hit, and whether or not it is pulled, amongst various other variables. In this regard, a pitcher has some, but not total, control over unintentional walks and strikeouts. The pitcher tries to fool the batter, but the batter may or may not buy the bait. The fielders are irrelevant before the ball is put into play, so the outcome is largely dominated by an exercise in game theory between the batter and pitcher.

A pitcher also controls the tendency of the ball to be on the ground or in the air. As noted above, once the ball is released from the pitcher's hand, what happens to it is ultimately a question of what the batter does. A pitcher can throw the ball with heavy sink to induce ground balls, or throw it high in the zone to induce a popup, but the hitter, not the pitcher, ultimately controls the angle of trajectory, the force of contact, and the direction of the ball off the bat. Once contact is made, the ball is either put in play, in which case the pitcher's fielders have the ultimate control over what happens next, or the ball is foul, in which case the batter-pitcher game repeats, or the ball is a home run, over which the pitcher has some, but not ultimate, control. (This is the theory behind xFIP and using a normalized home run rate in lieu of the pitcher's actual home run rate as traditionally used in FIP.)

BABIP research by ball in play type out indicates that league fielding per batted ball type tends to be relatively stable. It tends to fluctuate annually, but only slightly and negligibly. For example, the expected hits rate on ground balls in play between 2004 and 2008 was .239. From 2008 to 2010, it was .236. So far this year, it is .238. The same is true for infield fly balls, line drives and outfield fly balls (though the latter two tend to fluctuate more, which is probably the result of scorer bias*). It is also true that line drive rate seems to remain relatively stable and out of pitcher control as well in the long run. Only a handful of pitchers have cumulative line drive rates that are not between 18 and 20 percent over the past five years, and most of those pitchers tend to be extreme batted-ball players. Even in the outlier, however, no pitcher has a line drive rate below 16 percent or above 22 percent. Noting this, you can probably say that Mat Latos' 9.2 percent line drive rate and Travis Woods' 24.5 percent line drive rate on the season are either the result of bad luck or funky scoring and that we should expect such to persist in the future.

*Note: scorer bias might make one skeptical of batted ball-based evaluation/prediction tools, but it is important to note that I am not, nor are most, preaching a black-and-white bible of truth with sabermetrics and sabermetric tools, but rather commenting upon the tendency of outcome or a rough baseline from which to make better, more informed decisions. Tools like tRA and the xWHIP Calculator are hardly perfect, but they lead to more informed analysis and decision-making.

From this research, I stood on the shoulders of men much smarter than myself and created the Expected WHIP (xWHIP) Calculator. (You can download the beta version for xWHIP3 by clicking here.) In case you are not familiar with how the xWHIP Calculator works, let me give you the quick rundown of how to use it and what it does. Refer to the picture of the beta of version 3.0 below (note: the 2008-2010 environment is loaded in the hits/outs created field; I do not have the runs created data for 2008-2010 to provide at this time).


The first and only manual step is data entry. Begin by entering data into the gray cells by using the player's page on Fangraphs. The xWHIP Calculator is calibrated to Baseball Info Solutions (BIS) batted ball data, and, to avoid unnecessary scorer bias through consistency, you need to enter BIS data, which is what is available on Fangraphs. You can also change the pink cells of "specialized data points," but will likely require information that is not publicly available to properly modify such. Hence, you should probably leave them untouched (well, unless you want to use a player's career home run per outfield flyball rate in lieu of the league average mark*).

*If you modify the HR/OFFB% cell, do not change the park factor cell, or you risk double counting.

Once you've entered the data, the rest is all automatic, courtesy of my tireless hours of work in creating the xWHIP Calculator. My xWHIP formula first adds up all the batted ball data, and then normalizes it based on a regressed line drive rate. I use 19 percent, or about the league average. Then, with my new "normalized" batted ball distribution, I multiply each ball in play form by its expected hits rate. This gives you expected hits. The calculator also also calculate expected home runs based on the normalized data.

Once a normalized batted ball distribution is created, the xWHIP Calculator also calculates an expected innings total (xIP). I calculate expected innings because actual innings pitched, like hits, is a function not only of player skill, but fielder interference/assistance and other statistical noise. A great or poor play is the difference between an extra batter faced and the end of the inning*. Expected innings is calculated by multiplying events by expected outs created by event. For example, a ground ball put in to play tends to result in 0.808 outs per occurrence. Caught stealing and pick off rates are something that varies by catcher and pitcher, but calculating such to be effectively utilized is something that I am not properly equipped to do. Hence, I use a league-average rate of .02 outs created per base runner to account for expected pickoffs and players who might get caught stealing. This formula gives me expected outs, which I then divide by three.

*This is why K% is more stable, indicative and, as a predictive/evaluational tool, valuable than K/9.

Using expected hits, expected home runs, and expected innings, as well as the other calculated data, we get a few valuable output points from the xWHIP Calculator. The primary purpose of the calculator and its calculations is to give a pitcher's expected WHIP. xWHIP may not be important from a purely sabermetrics standpoint, but fantasy baseball players find it quite useful. xWHIP is calculated in three ways. First, xWHIP1 calculates a pitcher's expected WHIP using actual innings pitched. Second, xWHIP2 calculates a pitcher's expected WHIP using expected innings (xIP). Finally, quick xWHIP, or qxWHIP, calculates a player's expected WHIP based purely on a player's actual innings pitched, strikeout total, and WHIP. qxWHIP was created by Alex Hambrick, and the theory behind it is explained here.

The xWHIP Calculator also has a quick-and-dirty defensive adjustment for pitchers that converts a team's defensive results into an expected "hits saved" compared to the hypothetical "league-average defense" per inning. This defensive adjustment has severe limitations (defense is hardly uniform infield-to-outfield, or player-to-player), and is optional, but it gives some sense of how a team's overall defense can be roughly expected to affect a player's "true talent" line.

In addition to xWHIP, however, the new versions of my xWHIP Calculator also tabulate two mainstream ERA estimators using normalized data. The first ERA estimator is eFIP, which is based on xFIP. xFIP is traditionally calculated by subtracting two times a pitcher's strikeout total by the sum of three times a pitcher's walk total plus 13 times .105 times that player's flyball total, all divided by innings pitched. The resulting figure is then added to some constant, usually 3.2, to scale xFIP to look like ERA. xFIP tends to be my ERA estimator of choice, but I have several problems with the popular version of the formula. First, it uses a pitcher's flyball total to calculate expected home runs. Flyball total is a composite of outfield fly balls and infield fly balls. As popups can never be home runs, it is silly to include them. In addition, home-run-per-outfield-fly-ball rates tend to be more stable over the long term than home-run-per-fly-ball rates.

Second, and perhaps this is offset by including popups in the traditional expected home run formula, xFIP does not account for line-drive home runs. Line-drive home runs are few and far between, but they do occur a few times per 100 hits that are scored as line drives.

Third, xFIP is tabulated irrespective of expected flyball or outfield flyball rate. Pitchers, as noted above, do not seem to have much control over line-drive rate. If a pitcher, particularly in smaller samples (which give you less valuable data outcomes), has an atypically low or high line-drive rate, then a pitcher's xFIP is skewed accordingly. The difference is, at most, a couple of home runs, but, like my infield flyball grudge with traditional xFIP, why use it if you don't have to?

Fourth, xFIP does not account for park factors. Each of the 30 major league parks has different park dimensions that uniquely affect home run totals. Petco and Busch Stadium affect pitcher's home runs allowed totals radically different than do the parks of Chicago. Players only play about 50 percent of their games at home, so you need to modify park factors accordingly, but the difference in expected ERA between Busch Stadium and Coors Field is substantial enough that it requires accounting, though that causes the xFIP formula to further sacrifice simplicity.

xFIP is a nice formula because it is simple and easy to calculate. Normally, accounting for my gripes would sacrifice much of xFIP's simplicity appeal. However, given all the calculations the xWHIP Calculator makes, calculating a modified expected FIP to correct for my gripes is simple. I term this modified xFIP formula "eFIP."

In addition to eFIP, the newest versions of the xWHIP Calculator will also calculated batted ball normalized versions of tRA or tERA, which I have termed "EXTRA." EXTRA is calculated the exact same way as tRA, but it uses the pitcher's normalized, not actual, batted ball data as the inputs.

Now that you know the parameters, let's look at some of the major league's leaders and losers in xWHIP, eFIP, and EXTRA using 2011's runs environment and statistics through May 27, 2011. You can download the data file by clicking here.

Before reviewing the data, take note of the following. First, the following calculations use major league outs/runs/hits numbers, not league-specific numbers, so American League pitchers will tend to fare worse than these numbers, while National League hitters will tend to perform better. Second, changes in a player's strikeout (xWHIP2) or walk rate (xWHIP1, xWHIP2) would have an appreciable effect on a pitcher's expected WHIP. Third, while only starting pitchers (pitchers with at least one game started) are included in my data file, with the exception of Zack Greinke, only starting pitchers with 30 or more expected innings are included in my leaderboard (136 starting pitchers qualify). Fourth, I am calculating WHIP with unintentional walks (BB-IBB+HBP, or uBB); uBB better evaluates a pitcher's control and expected baserunners. Finally, the league average xWHIP and eFIP are 1.32 and 4.00, respectively. The actual current major league average WHIP and FIP are 1.30 and 3.95, respectively.

First, the WHIP under-performers to date (calculated using "actual WHIP" (see above) minus the mean of a pitcher's xWHIP1 and xWHIP2):
Name                   xIP        aWHIP     xWHIP     dWHIP
Davies, Kyle 44.54 1.90 1.57 0.34
Lackey, John 42.57 1.88 1.63 0.25
Reyes, Jo-Jo 55.06 1.66 1.42 0.24
Arroyo, Bronson 67.25 1.52 1.30 0.21
Greinke, Zack 29.99 1.14 0.93 0.21
Capuano, Chris 57.87 1.48 1.28 0.20
Dempster, Ryan 66.79 1.56 1.36 0.19
Garza, Matt 59.54 1.35 1.16 0.19
Holland, Derek 61.03 1.58 1.39 0.18
Jackson, Edwin 70.82 1.50 1.33 0.17
Tillman, Chris 50.41 1.67 1.50 0.17
Scherzer, Max 67.28 1.48 1.32 0.17
Carpenter, Chris 73.60 1.43 1.28 0.15
Lee, Cliff 78.18 1.25 1.10 0.15
Myers, Brett 69.78 1.51 1.39 0.13
McDonald, James 54.30 1.52 1.40 0.12
Norris, Bud 68.42 1.30 1.18 0.11
Dickey, R.A. 61.18 1.60 1.49 0.11
Francis, Jeff 69.59 1.40 1.30 0.10
Wood, Travis 62.79 1.41 1.31 0.10
Hudson, Dan 72.45 1.33 1.23 0.10
Rodriguez, Wandy 67.84 1.32 1.22 0.10
Lilly, Ted 63.55 1.34 1.25 0.09
Duensing, Brian 54.92 1.44 1.36 0.09
Morrow, Brandon 40.47 1.38 1.30 0.08
Baker, Scott 61.52 1.30 1.22 0.07
Stauffer, Tim 65.87 1.32 1.25 0.07
Niese, Jon 62.10 1.44 1.38 0.06
Volstad, Chris 52.02 1.44 1.38 0.06
Danks, John 66.59 1.40 1.34 0.06
Harang, Aaron 61.74 1.32 1.26 0.06
Narveson, Chris 57.44 1.35 1.29 0.06

Much of this leaderboard is populated with under-inspiring pitchers who, while unlikely, have pitched pretty poorly this year and are hardly worth a spot on your bench. Case in point: the injured John Lackey and "immutable" Kyle Davies. A few names do stand out, however. I think the ship sailed on Ryan Dempster (whose numbers are infinitely better if you omit his 0.1 inning pitched disaster at Arizona) after his 11-strikeout performance on May 13, but maybe some owner has not been paying close enough attention this past month (e.g., people in college). We all know Cliff Lee and Matt Garza have had their share of bad luck this year, but what about Chris Carpenter and Zack Greinke? Greinke's performance to date puts him in company with the top three guys in the league, but his 5.79 ERA has been ugly. If any owner is having second thoughts about the Royals ex-Ace, or is willing to deal him at market value, I'd strongly considering biting. And what about Bud Norris? I wrote about him last week, but his ownership rate is still below 50 percent (it actually went down a notch). I think a lot of people are overlooking just how good Norris has been this year. Jeff Francis and Travis Wood are a pair of pitchers who could help you in other categories without hurting your future WHIP.

Next, the WHIP over-performers to date (calculated using "actual WHIP" (see above) minus the mean of a pitcher's xWHIP1 and xWHIP2):
Name                   xIP        aWHIP     xWHIP     dWHIP
Tomlin, Josh 60.26 0.93 1.24 -0.32
Lohse, Kyle 67.89 0.91 1.22 -0.30
Humber, Philip 56.67 0.98 1.28 -0.30
Britton, Zachary 59.14 1.12 1.38 -0.26
Ogando, Alexi 54.57 0.94 1.18 -0.25
Johnson, Josh 56.03 0.96 1.19 -0.23
Hudson, Tim 62.97 1.14 1.35 -0.22
Morton, Charlie 58.11 1.31 1.52 -0.21
Harrison, Matt 55.43 1.25 1.46 -0.20
Chacin, Jhoulys 64.78 1.10 1.30 -0.20
Maholm, Paul 66.89 1.16 1.36 -0.20
Beckett, Josh 58.97 0.98 1.18 -0.19
Penny, Brad 59.28 1.32 1.51 -0.19
Hochevar, Luke 70.45 1.23 1.41 -0.18
Liriano, Francisco 46.26 1.48 1.66 -0.18
Verlander, Justin 75.59 0.96 1.14 -0.17
Jurrjens, Jair 54.41 1.02 1.19 -0.17
McClellan, Kyle 61.16 1.21 1.38 -0.17
Haren, Dan 77.03 0.89 1.06 -0.16
Kennedy, Ian 71.84 1.10 1.24 -0.14
Coke, Phil 49.98 1.27 1.41 -0.14
Moseley, Dustin 57.56 1.23 1.37 -0.14
Burnett, A.J. 65.88 1.29 1.42 -0.14
Hanson, Tommy 62.63 1.09 1.22 -0.13
Carmona, Fausto 70.32 1.22 1.34 -0.13
Correia, Kevin 68.79 1.19 1.31 -0.12
Billingsley, Chad 67.93 1.26 1.37 -0.12
Cahill, Trevor 69.18 1.23 1.35 -0.11
Pineda, Michael 61.86 0.99 1.11 -0.11
Lincecum, Tim 74.38 1.05 1.16 -0.11
Hellickson, Jeremy 55.45 1.24 1.35 -0.11
Weaver, Jered 82.98 0.96 1.06 -0.10

Here we find a lot of players with BABIP-deflated ERAs who are on the Atkins diet when it comes to strikeouts: Kyle Lohse and Zach Britton's combined strikeouts per nine rate (9.81) is equal to that of Bud Norris. Most of these "trailers" tend to be groundball pitchers because groundballs, while having a lower expected runs outcome per event, have a higher hits-resulting rate. A year of xWHIP has taught me that ERA and WHIP tend to be inversely related to groundball and flyball rates. Alexei Ogando throws hard, but can you really trust a flyball pitcher (64.5 percent AO%) in Texas (inflates home runs by 10 percent)? Ogando's SwStr% (8.9 percent) indicates he is capable of slightly better than league-average strikeout totals. As you might notice not all players on this board are "bad" or have "bad" expected WHIPs (e.g., Josh Beckett). This is only a tool to help figuring out who has been under/over-performing, and an under-performer may very well be worth keeping.

Then we have the pitchers who are secretly better than their listed FIP.
Name               xIP      aFIP    EXFIP   dFIP
Karstens, Jeff 45.60 4.92 3.57 1.35
Volquez, Edinson 51.36 5.77 4.50 1.27
Arroyo, Bronson 67.25 5.48 4.33 1.15
Gorzelanny, Tom 52.31 5.28 4.14 1.14
Hochevar, Luke 70.45 5.46 4.35 1.11
Dempster, Ryan 66.79 4.80 3.78 1.03
Myers, Brett 69.78 5.44 4.49 0.95
Greinke, Zack 29.99 3.06 2.18 0.88
McDonald, James 54.30 5.11 4.29 0.82
Lester, Jon 68.85 4.25 3.48 0.77
Capuano, Chris 57.87 4.61 3.86 0.75
Bedard, Erik 51.52 4.32 3.68 0.65
O'Sullivan, Sean 50.48 6.26 5.61 0.64
Lewis, Colby 64.90 5.26 4.62 0.64
Latos, Mat 53.83 4.35 3.80 0.55
Buchholz, Clay 58.87 4.77 4.25 0.52
Romero, Ricky 63.02 3.98 3.48 0.50
Baker, Scott 61.52 4.19 3.70 0.49
Pelfrey, Mike 64.67 5.07 4.59 0.48
Carmona, Fausto 70.32 4.29 3.82 0.47
Colon, Bartolo 57.80 3.79 3.32 0.47
Blackburn, Nick 62.39 4.65 4.19 0.47
Norris, Bud 68.42 3.75 3.30 0.45
Chen, Bruce 41.62 5.12 4.68 0.45
Arrieta, Jake 60.54 4.66 4.23 0.43
Chacin, Jhoulys 64.78 3.96 3.56 0.40
Scherzer, Max 67.28 4.36 3.98 0.39
Lilly, Ted 63.55 4.67 4.28 0.39
Dickey, R.A. 61.18 4.75 4.37 0.38
Gallardo, Yovani 68.64 4.27 3.91 0.36
Litsch, Jesse 46.74 4.69 4.35 0.34
Kuroda, Hiroki 70.70 4.15 3.81 0.34
Rodriguez, Wandy 67.84 4.05 3.71 0.33
Liriano, Francis 46.26 5.44 5.11 0.33
Volstad, Chris 52.02 4.24 3.91 0.33

If there is any pitcher to avoid on this list, it's Edinson Volquez. I took a lot of flack being a vocal Volquez hater this offseason, and while it's only been 51 innings, I really want to say "I told you so" about how bad his control was going to burn him this year. Volquez has a 4.16 xFIP, so a lot of people might be tempted to buy, but even if you tinker with his batted ball distribution a bit, his expected FIP is putrid. A 4.50 FIP would be "average" by standards two or three years ago, but in the new era of the pitcher, it's trade-or-cut material. Ryan Dempster's a name on this list I really like, but, as noted above, the ship has probably sailed on him by now. Same goes with Erik Bedard, who has been lights out over his past five or so turns. And what about Bartolo Colon? Is he the real deal after injecting cheeseburgers from his belly into his elbow? No matter which you choose, all the metrics seem to check out (3.77 ERA, 1.20 WHIP, 3.61 FIP, 2.90 xFIP, 3.86 eFIP, 1.20 WHIP, 1.28 xWHIP), but something does not smell right. A 5.9 percent SwStr% ties for his second-lowest mark since 2002 and is well below his post-2002 average of 7.6 percent, but his strikeout rate (23.6 percent) is a career second-best at age 38? I'd use the "it checks out" line to hedge your risk.

What's up with Jeff Karstens? He's been good on the surface (3.57 ERA, 1.28), but regular FIP says look out (4.70). Karsten's improved strikeout rate (18.9 percent this season, 12.2 percent career) makes sense if you look at batters' swing-and-miss rate against him (9.0 percent this year, 7.1 percent career, 8.4 percent major league average), but what is causing it? It's not his velocity (88.4 MPH fastball this year, 88.5 career) or pitch usage (none of his four usage rates varies by more than a few percent points this season). His change-up has been wicked awesome, but both his fastball and slider (thrown almost a combined three-fourths of the time) have fared poorly both this year and for his career. Tread at your own caution.

Chris Capuano, on the other hand, has been secretly good for the Mets, even if the results do not say so. His ERA (4.94) and WHIP (1.45) have been atrocious, but his peripherals (3.86 eFIP, 1.28 xWHIP, 7.74 K/9, 19.4 percent K%) say this waiver wire fodder (2 percent Yahoo ownership) might be worth a careful look.

And the guys whose FIPs are not telling the whole story. Keep in mind that in the second "year of the pitcher," ERAs are not what they used to seem.
Name               xIP      aFIP    EXFIP  dFIP
Bergesen, Brad 51.38 3.90 5.15 -1.26
Morrow, Brandon 40.47 2.53 3.63 -1.09
Tillman, Chris 50.41 3.85 4.89 -1.04
McCarthy, Brando 62.85 2.67 3.60 -0.93
Jurrjens, Jair 54.41 2.97 3.85 -0.88
Coke, Phil 49.98 3.83 4.65 -0.81
Hudson, Dan 72.45 2.88 3.66 -0.78
Buehrle, Mark 72.50 3.82 4.59 -0.76
Zimmermann, Jord 60.00 2.98 3.73 -0.75
Sabathia, CC 77.83 2.99 3.70 -0.71
Fister, Doug 63.85 3.57 4.27 -0.70
Garza, Matt 59.54 2.01 2.71 -0.69
Lohse, Kyle 67.89 3.23 3.91 -0.68
Bumgarner, Madis 57.50 3.16 3.84 -0.67
Zambrano, Carlos 66.71 3.94 4.57 -0.62
Humber, Philip 56.67 3.77 4.35 -0.59
Hernandez, Livan 68.75 3.94 4.47 -0.53
Halladay, Roy 86.09 1.93 2.46 -0.53
Billingsley, Cha 67.93 3.29 3.82 -0.53
Johnson, Josh 56.03 2.72 3.24 -0.52
Masterson, Justi 64.33 3.23 3.72 -0.49
Marquis, Jason 63.53 3.80 4.27 -0.47
Weaver, Jered 82.98 2.74 3.21 -0.46
Oswalt, Roy 44.97 3.29 3.73 -0.44
Kennedy, Ian 71.84 3.41 3.84 -0.42
Beckett, Josh 58.97 3.03 3.45 -0.42
Pineda, Michael 61.86 2.84 3.25 -0.42
Morton, Charlie 58.11 3.91 4.29 -0.38
Reyes, Jo-Jo 55.06 4.25 4.61 -0.36
Maholm, Paul 66.89 3.60 3.96 -0.36
Chatwood, Tyler 53.24 5.09 5.45 -0.36
Nova, Ivan 54.62 4.61 4.96 -0.36

My mother always told me to never trust Brandon Morrow. As I noted last week, you're better off selling him at cost to another saber-friendly owner and investing the funds elsewhere. Jordan Zimmerman is much better than he's been or his presence here indicates, and I would sit tight with him. Is Justin Masterson finally putting it all together as a post-hype sleeper? 3.61 xFIP versus lefties (165 batters) and 3.26 xFIP versus righties (110 batters). Sorry Orioles fans clinging to old Bedard jerseys; Chris Tillman is not the stud or the sleeper we thought he was. Ditto on Brad Bergesen, who I once had a fantasy man crush on several years back. After 10 years, you should not be fooled by Jason Marquis. He tends to start things off well with new teams, but it always ends badly. Has Doug Fister been ol' reliable for you thus far? Don't expect it to persist, as he's more likely to take his hand and slap your fantasy team with it in the future. I've shaken off my preseason (Phil) Coke addiction, and what of former top Twins draftee Phil Humber? 2.85 ERA, 3.77 FIP looks nice for something you plucked off the waiver wire for a stream that never seemed to end in a drop, but lackluster strikeouts plus league-average WHIP plus poor ERA prospects equal trade toss in to get a better deal done. Finally, Livan Hernandez is not even worth mentioning.

Next time out (this upcoming Monday), we'll look at EXTRA, actual ERA and actual tRA to date. Until then, as always, leave your love/hate in the comments below.

NL Waiver Wire: Weeks 7 and 8

Celebrating my one year anniversary working for The Hardball Times this week. Here are the latest tabs on the NL Edition of the Waiver Wire series: Week 7 and Week 8.

Enjoy

DME's All Over The NL Waiver Wire

With fantasy baseball season back in swing, I've resumed my bifurcated position at The Hardball Times covering the fantasy baseball waiver wire. This season, Josh Shepardson and I flipped spots and I will be covering the Senior Circuit, while he'll be covering the American League.

So far, I have three entries logged:
  1. The Preseason Special (where the twitter meme #GoingToTheBeach was born)
  2. Waiver Wire Week 2 (no week 1 article, as there was too little data to confidently suggest anyone not listed in the preseason post)
  3. Waiver Wire Week 3 (this past Friday's post)

With my law finals kicking in to gear, Brad Johnson will be covering the NL Waiver Wire for the next 3 or 4 weeks. Wish me luck.

DME's Updated Fantasy Rankings By Position.

It took forever to overhaul, but I just released my completely up-to-date fantasy rankings by position over at The Hardball Times. The first baseman and third basemen ranking in particular have been entirely overhauled.

On a lighter note, we at Game of Inches plan to run a series of baseball season previous podcasts breaking down each baseball division (one division per podcast). Stay tuned for that awesomeness.

DME's Top 60 Outfielders, Top 100 Starting Pitchers and Top 50 Relievers for fantasy in 2011

I have been AWOL for a little while, but my latest rankings for The Hardball Times, are out, finishing off my early preseason positional rankings. Click the relevant links below. I will be releasing an updated list in about one month.
Fantasy Outlook: Embracing Randomness and Playing for This Year

A few months ago, The Hardball Times ran a competition offering prospective fantasy baseball writers and fanatics the opportunity to compete in the inaugural Hardball Times fantasy league. The competition entailed the writing of fantasy baseball articles, the best of which would be chosen as our winner. While we could only choose one winner, we had so many great articles. What follows is one of my favorite submissions, which was written by Alan Gellin. I think you will enjoy this article as much as I did.

Each year, there are fantasy baseball team owners who decide that they will rebuild their roster and play for next year or some future year. These decisions are usually based on a team’s keeper list as compared to the other teams in the league. If I happen to be in a league where an owner declares his intention to play for next year, it is a time to rejoice because I have one less team to compete with for first place this year. While I look forward to competing with owners that play for next year, the purpose of this article is to build a case for the idea that you should always play for this year.

The basic premise underlying the argument to play for this year is the notion that we should embrace randomness. This concept of embracing randomness came to me after reading The Black Swan by Nassim Nicholas Taleb. A Black Swan is an event that occurs, positive or negative, that has great impact and could not be predicted. A positive example would be an unknown author’s first book becoming an international bestseller and a negative example would be the September 11, 2001 attacks. These seemingly random events cannot be predicted because we are not aware of the underlying factors at work that lead up to and contribute to making these events possible.

In fantasy baseball, the seeming randomness of statistics and the near impossibility of accurately predicting player performance from year to year can be challenging. The fantasy baseball industry has gotten better at predicting player performance but each year there are positive and negative Black Swans that impact team rosters. This year’s most famous example is the 54 home run season of Jose Bautista. This is a classic positive Black Swan event (if he was on your roster!) but there are hundreds of other examples of players not living up to or far exceeding the expectations placed upon them each season.

Since we are generally not privy to the information that contributes to unpredictable player performance, let us embrace this randomness. We really do not know for sure how any one player will perform, let alone an entire roster of players. There are always rostered players that underperform and there are always players in the free agent pool that outperform expectations. Your competitor’s unbeatable keeper list in the preseason can suddenly look beatable with unexplained drops in player performances and injuries. Taking this thought one or two years down the road: your rebuilt team’s keeper list will be subject to the same unpredictability as your competitor’s keeper list this year.

Embrace randomness. Play for this year. It’s a lot more fun than waiting around for a championship that may never happen.

Alan Gellin is a 26 year veteran of fantasy baseball and will be playing to win again this year. Comments are welcome at agellin@buffalo.edu.

THT Mock Draft Results

The results from The Hardball Times fantasy mock draft are in. Browse the teams, vote on your favorites. Both Sexy Rexy and I participated.

The post-draft analysis will come in the following weeks, but for now, just check out my amazing team.

xWHIP 2.0: The Next Generation

The following article is from my most recent article for The Hardball Times.

A few months ago, I debuted the first version of the expected WHIP (xWHIP) calculator, which took a pitcher's batted ball distribution and, in determining an expected number of hits, calculated that pitcher's expected WHIP. The tool was tinkered with and refined until version 1.4.3 was released and that, until now, has been the primary xWHIP tool available. xWHIP 1.4.3 overexpected WHIP a bit, but was otherwise pretty solid. Especially for relative comparison purposes, xWHIP 1.4.3 was a useful fantasy tool.

Not long ago, I was introduced to a fellow stathead by the name of Martin Alex Hambrick. He had done some number tinkering similar to what I had done independently with the xWHIP calculator, and he had an idea. He brought that idea to my attention, and from it a new formula for expected xWHIP was born.

Alex's idea was that a pitcher's actual innings pitched (aIP) are as much the by product of luck as expected hits (xHits). The theory is that a medley of defense, umpires, errors, random luck and the like skew the length of innings. The pitcher, for example, does not particularly control dropped third strikes by his catcher.

This idea is somewhat captured in the K% (K/TBF) and BB% (BB/TBF) movement of sabermetrics that rejects K/9 and BB/9 because the length of innings is largely out of the control of the pitcher, thereby skewing both K/9 and BB/9. Accordingly, we began work on a new denominator for xWHIP that incorporated an expected innings (xIP) total based on a pitcher's outs-creating events.

With this idea in mind, we began work on a new xWHIP calculation. Law school delayed my work on a final formula until this week, but with "way too much time on my hands" (i.e., any lawyers out there need a law clerk for the summer?), I finally got around to hammering out a reliable formula and user-friendly interface, calibrated to Baseball Info Solutions (BIS) data.

The current formulation for expected innings is as follows:

xIP = ((K*1.000075)+((BB-IBB+HBP)*0.00016)+((0.808)*GB)+((0.278)*LD)+((0.992)*IFFB)+((0.745)*OFFB)+(0.020099*(BB+HBP+xH)))/3

The coefficients in the above formula represent the expected outs by event rate. You might notice the two percent adjustment applied to both modified walks (BB-IBB+HBP) and expected hits (xH). That figure represents a ten-year average outs-per-runners-put-on-base rate (ORB). ORB encapsulates the ten-year league average pickoff and caught stealing rates.

Because catcher defense and a pitcher's pickoff talents are difficult to measure, and also not widely available, using a league average rate helps make the calculator more accessible. The final xWHIP figure should be mentally modified based on one's own perception of a catcher's pickoff ability or a pitcher's pickoff ability. If Jason Varitek is the catcher, you might want to raise the pitcher's calculated xWHIP, while the opposite would be true for those pitchers handled by Yadier Molina.

Alex is working on a simplified "Quick xWHIP" formula that simplifies the xWHIP calculation even further, to the point that you could do it on a calculator. He'll tell you more about that (and the accuracies of both xWHIP 2.0 and Quick xWHIP) in a (near-) future post. All I can say for now regarding the calculator's accuracy, at least to some degree of certainty, is two things. First, xWHIP works best—that is to say, it is most predictive—when you use multi-year data rather than year N-1 data. Second, the R^2 of the data seems to be solid for a predictive state.

Someone once told me (or maybe I just read it somewhere) that an R^2 of .30-.35 is strong for a predictive stat, while a .60 or greater R^2 is what is required of an evaluative stat. Using 2007 xWHIP 2.0 to predict 2008 actual WHIP resulted in an R^2 of .34 amongst the 78 pitchers who faced a minimum of 500 batters, compared to an R^2 of .26 for 2007 actual WHIP. Likewise, using 2008 xWHIP to predict 2009 actual WHIP resulted in an R^2 of .36 amongst the 80 pitchers who faced a minimum of 500 batters, compared to an R^2 of .30 for 2008 actual WHIP.

Strangely, however, using 2009 xWHIP to predict 2010 xWHIP amongst the 82 pitchers who accrued 500+ total batters faced merely resulted in an R^2 of .15 (compared to a .14 R^2 for 2009 actual WHIP). Maybe I crunched the 2009-2010 data incorrectly. Maybe this is a sample size issue. Maybe not. As I mentioned above, Alex will supply more details on the accuracy of xWHIP 2.0 shortly.

I also tinkered some with the expected hits formula, but the changes are relatively minor and hardly warrant discussion. The important thing to note about the new xWHIP tool is that it is now calibrated per the past five years of BIS data rather than Game Day. I have done this because I believe that Fangraphs utilizes BIS, not Game Day, as their source for ball in play (BIP) data. Accordingly, this should make the tool more accurate for the average user. Most of the data stood relatively stable, but here are the new expected hits by batted ball types:
  • Popups: .004
  • Groundballs: 0.236
  • Outfield Flyballs: 0.250
  • Line Drives: 0.716
These data points include home runs, which is why the Outfield Flyball expected hits rate is so high. If you take home runs out of the equation and account for them separately (as the xWHIP calculator does), the expected hits rate, per BIS, for Outfield Flyballs and Line Drives falls to .158 and .714, respectively.

You can download the new xWHIP tool, version 2.0, by clicking here. The password to utilize the xWHIP tool is still "soto 18" and the batted ball data you will need to plug in can be found at Fangraphs.com.

Picture below is a screenshot of the xWHIP 2.0 tool, which was used in my Zack Greinke forecast article. For explanatory purposes, this screenshot has the 2010 numbers of Roy Halladay plugged in.


As the instructions on the tool indicate, the gray cells are for data you should manually input. The magenta park factor cell is also a manual data cell, though the number should be left at "1.00000" unless you have the relevant park factor HR/FB index figure. You should not enter any data into any of the blue, green or yellow-orange cells.

The green cells feature the line drive-regressed expected-ball-in-play data. The yellow-orange cells display the expected innings, expected hits and expected WHIP for the pitcher, irrespective of defense. If you enter data into the Team Innings Pitched and Team UZR gray cells, then the blue cells will display a crude defensive adjustment to the expected hits total, assuming uniform defense and that all saved hits would be of the singles variety. All of the data cells are pre-formatted to visually round all numbers to keep the sheet clean, though cells will retain the full value of any number entered.

I also included a cell for xWHIP 1.4.3, calibrated from Game Day to BIS, in case people wanted to know a player's expected WHIP using expected hits and actual innings, rather than expected innings.

I hope everyone enjoys this. If you have any questions/concerns/comments/criticisms, please post them in the comments below or email them to gameofinchesblog@gmail.com, with the subject line "xWHIP 2.0 Calculator."

On a final note, I would like to give a special thank you to several of my THT colleagues who have been invaluable in the creation of the xWHIP 2.0 tool. Without the assistance of Derek Carty, Dave Studemund, and Harry Pavlidis, none of this would have been possible. I apologize to each of you for my incessant e-mailing in attempt to work out the mathematical kinks in the formula.

DME's Top 20 Fantasy Middle and Corner Infielders for 2011

My latest preseason rankings for The Hardball Times, the top 20 fantasy middle and corner infielders for 2011, are out. Enjoy.

Stolen Goods: The Stats We Target

An article by a colleague of mine, Paul Singman (of Yahoo Friends and Family league fame), recently came to my attention. This article maps out 2008 ADP against 2007 production by stat, using the standard hitting categories.

According to the data, home runs and steals are the most significant when it comes to determining ADP. Of more interest, however, is the distribution of stats and their ADP relevance. Which stats are most undervalued by ADP? Which stats are you most able to accrue late in the game? Check it out, cool stuff.

DME's Top 20 Fantasy Third Basemen for 2011

My early 2011 fantasy rankings for third basemen have gone live on The Hardball Times. Enjoy.

Happy holidays everyone!

A Bullet Point Retrospective Of This Past Decade

Last night, I stumbled across a perplexing top 100 players of 2000-2009 list by none other than Rob Neyer. I usually respect Neyer's opinion, but his list was way out of whack. For example, not only was Johan Santana ranked ahead of Randy Johnson, but Randy Johnson was barely ranked in the top 20 (No. 18)! There is no justification for ranking any of Jorge Posada, Bobby Abreu, Johan Santana, Todd Helton or Lance Berkman ahead of the Big Unit, arguably the best pitcher of the modern era.

The list kind of gave me a headache and got me thinking. With the new year around the corner, another season removed from the Steroid era, Neyer's list ineffably inspired me to look at some leaderboard data from 2000-2009, courtesy of the new time-span feature on Fangraphs. Here is what I found:
  • Per cumulative UZR, the 10 best defenders at a single position of the past decade were Andruw Jones (CF, +120.8), Adrian Beltre (3B, +113.2), Carl Crawford (LF, +97.7), Scott Rolen (3B, +96.4), and Ichiro Suzuki (RF, +83.1). Note that cumulative UZR is ranked for player by position played, not by player en toto.
  • Per cumulative UZR, the 10 worst defenders at a single position of the past decade were Manny Ramirez (LF -110.2), Jermaine Dye (RF, -103.5), Brad Hawpe (RF, -83.8), Dunn (LF, -71.5), and Bobby Abreu (RF, -60.7). SexyRexy's boy Michael Young ranked No. 6, with a -60.7 UZR at SS, while Jason Bay (LF, -47.1 UZR), Pat Burrell (-44.6 LF) and Johnny Damon (CF, 41.6) all wished they played more DH.
  • Accounting for difference in position (an 87.8 run adjustments, the difference between Andruw Jones playing all of his CF time over the last decade in the corners) to allow apple-to-apple comparisons, the difference between the best (Andruw Jones, CF) and worst (Manny Ramirez, LF) fielders at a single position over the last decade was 319 runs. In other words, on average, the difference between using Manny in left instead of Jones would cost you 3.2 WAR. That is how many WAR David Ortiz was worth in 2010, how many WAR Elvis Andrus was worth in his rookie year, and +4.7 more WAR than Neifi Perez accrued over the course of his career (-1.5 WAR). Scary, right?
  • The five most plunked batters of the past decade were Jason Kendall (159), Jason Giambi (138), my boy David Eckstein (134), Craig Biggio (132), and Carlos Delgado (126). Utley, who only became a full-time player in the middle of the decade, was plunked a ridiculous and league leading 99 times from 2005-2009.
  • Of pitchers who threw 1,000 or more innings last decade, Johan Santana had the lowest tERA (3.31), Curt Schilling had the lowest xFIP (3.16), and Pedro Martinez had the lowest FIP (2.92) and ERA (3.02). If we lower the IP threshold to 400 and only include starting pitchers (ignoring guys like Mariano Rivera and Eric Gagne), then Tim Lincecum ranks No. 1 in tERA (2.91), FIP (2.75) and ERA (2.91). Lincecum was "only" third best in xFIP (3.23), behind only Curt Schilling (3.16) and Randy Johnson (3.21).
  • Only three starting pitchers who tossed 400+ innings last decade averaged a strikeout rate of 10 or more batters per nine innings: Randy Johnson (10.37), Mark Prior (10.37), and Tim Lincecum (10.17). Only Big Unit pitched more than two full seasons last decade, however, making his achievement all the more impressive. Kerry Wood (9.94) and Pedro Martinez (9.93) came damn close to making this list.
  • Brad Radke had the best walk rate of any pitcher who tossed 600+ frames last decade, a hard better than big fat David Wells (1.40), while Daniel Cabrera (5.24) and Victor Zambrano (5.15) were the only 600+ inning pitchers of the past decade to walk more than five batters per nine. Oliver Perez (4.95) is crying somewhere.
  • Kirk Reuter did his best to post a K/BB under 1.00 last decade, but failed (1.03). Daniel Cabrera was also pretty bad (1.30). Meanwhile, Curt Schilling's 6.01 K/BB mark last decade was by far the best. The second and third best K/BB posters of the last decade, Mariano Rivera (4.88) and Pedro Martinez (4.63), couldn't hold a candle to Schilling's bloody sock of control.
  • In terms of Fangraphs WAR value (for pitchers, this is based on FIP), the 10 most valuable players of the past decade were: Alex Rodriguez (+76.4), Albert Pujols (+73.3), Barry Bonds* (+65.1), Randy Johnson (+55.8), Chipper Jones (+54.2), Todd Helton (+53.8), Lance Berkman (+53.8), Roy Halladay (+53.8), Andruw Jones (+50.1), Javier Vazquez (+49.2). Curt Schilling (+45.6 WAR) barely missed the cut.
  • The five worst hitters (per cumulative batting runs) of the past decade were almost exclusively shortstops: Jack Wilson (SS, -121.4), Cristian Guzman (SS, -99.7), Omar Vizquel (SS, -84.6), Vinny Castilla (3B/SS, -75.3), and Orlando Cabrera (SS, -72.4). This goes to show that even in the era of offensive shortstops, shortstops were still amongst the worst hitters in baseball.
  • Juan Pierre (-44.0 batting runs) was the worst non-shortstop playing hitter of the past decade.
  • The five best hitters (per cumulative batting runs) of the past decade were Barry Bonds* (+570.7), Albert Pujols (+566.3), Alex Rodriguez (+499.5), Manny Ramirez (+447.9), and Lance Berkman (+415.7). No surprise here, as these Hall of Fame-worthy hitters were the only hitters to accrue 400+ batting runs last decade. Sorry, Todd Helton (+396.7).
  • The difference between using Jack Wilson over Barry Bonds at DH last decade would have resulted in a loss of 687.7 runs, or a ridiculous 6.9 WAR per season. Thank god Jack Wilson, when healthy, is one of baseball's most elite defenders at one of baseball's hardest positions to field, right?
  • In terms of total fielding value (cumulative fielding runs), the five worst fielders of the past decade were Manny Ramirez (-126.0), Bernie Williams (-119.5), Adam Dunn (-115.9), Jermaine Dye (-106.3), and last year's gold glove winner Derek Jeter (-77.8). This list closely tracks the UZR/position list, but gives a more complete picture of each player's total defensive value.
  • In terms of total fielding value (cumulative fielding runs), the five best fielders of the past decade were Andruw Jones (+176.1), Adrian Beltre (+115.8), Scott Rolen (+114.4), Ichiro Suzuki (+110.5), and Placido Polanco (+101.1). Carl Crawford (+100.7) was the only other name to eclipse the 100 fielding runs mark, though something tells me Chase Utley (+74.0) would have as well if made a full time player before 2005. This list closely tracks the UZR/position list, but gives a more complete picture of each player's total defensive value.
*With respect to Bonds, remember he stopped playing baseball after 2007 and barely played (52 PA) in 2005. His inclusion at number 3 on this list despite only playing two-thirds of the decade are testament to his greatness, steroids or not.

As always, leave the love/hate in the comments.