Showing posts with label Fantasy Outlook. Show all posts

Looking ahead: 2011 xBABIP-adjusted batting lines

The following is from my latest article for The Hardball Times.

Don't forget to follow THTFantasy on Twitter. A special shout-out thanks to Yizhe Shen for helping me compile the data for players on multiple teams this year.

Each of the past two seasons, I have made it a habit to use The Hardball Times' expected BABIP (xBABIP) formula in an attempt to take a somewhat luck-neutral look at batting lines from the previous year to help better forecast relative value for the (ages away) upcoming season. Not to break habit, what follows is a breakdown of 2011 batting lines.

Before I present the data, which can be accessed and sorted by clicking here, let me explain my methodology and the crucial-to-understand underlying assumptions. If you have not yet read Chris Dutton and Peter Bendix's article on their xBABIP formula, I suggest doing so before proceeding, because I use their formula.

Step one is calculating each player's xBABIP. This can be done through a variety of methods, but as I have indicated above, I use Chris Dutton and Peter Bendix's xBABIP formula. It is worth noting that other xBABIP formulas do exist, such as the one posted by slash12 a couple of years ago on Beyond The Boxscore. xBABIP is a theoretical model, and each formula has its own pros and cons.

I prefer to use The Hardball Times' version because 1) I'm a company man and 2) it accounts for park (though admittedly, the park factor data are a few years old now, and for a few teams—the Yankees, Twins, Mets, and starting next year, the Marlins—the park factors are entirely obsolete). Feel free to use the follow methodology of determining batting line with whatever formulation of xBABIP you choose.

Once you have calculated each player's xBABIP (a feat easier said than done, especially if you have to account for partial seasons and league/park factors), you will need to apply it using fancy algebra to determine a player's expected, luck-neutralized batting average (xAVG), on base percentage (xOBP), and slugging percentage (xSLG).

To calculate expected batting average, you begin by calculating the expected hits differential between a player's actual BABIP and his expected BABIP. To calculate a player's expected hits total, simply rearrange the BABIP formula using xBABIP in place of actual BABIP.

In other words, a player's expected hits are equal to that player's actual home run total plus his xBABIP times the following: At-bats minus strikeouts minus home runs plus sacrifice flies. In other words, xH=HR+xBABIP*(AB-K-HR+SF). Take this expected hits total and divide by at-bats to get xAVG.

Next, you will need to calculate xOBP. This is done by simply taking the quotient of the sum of hits, walks and hit by pitches and dividing that by the sum of at bats, walks, hit by pitches, and sacrifice flies. Not too complicated.

Calculating xSLG is at least as easy as calculating xOBP, but how you calculate it largely depends on how you perceive xBABIP to affect hits. If you think that a player's power rate would remain constant irrespective of BABIP luck, then you simply calculate a player's actual ISO (slugging percentage minus batting average) and add that value to his expected batting average.

If you pessimistically/optimistically believe that all hits gained/lost to BABIP luck were singles, then you calculate xSLG as by adding the difference between expected hits and actual hits to a player's singles total, and then dividing the sum of singles plus two times doubles plus three times triples plus four times home runs by at-bats.

As may be obvious, both methods have their own issues with calculating the expected power of the hits gained/saved through BABIP luck.

The first xSLG method holds power constant, which seems nice in theory. However, given that home runs totals are generally not affected by BABIP luck hit changes, using ISO either over/underestimates power depending on whether xBABIP would either subtract or add hits to a player's final line.

With the hits-added method, a player would be adding non-home run hits at an ISO pace that includes home runs. Alternatively, if hits are subtracted, it is subtracting some home run power value.

The "be overly pessimistic/optimistic approach" of course greatly oversimplifies this error, but it does so with a degree of skepticism. For hits added, we see what life would be like if all hits were singles, and think that there's power upside to be had in the projection.

Alternatively, for hits subtracted, we get some dose of reality with the understanding that there's a little more risk than the downward adjustment the numbers indicate. You might think of a hits-subtracted situation assuming all singles as the "upside" of luck-adjustment.

So pick you method of xSLG; each has its own vices. I prefer to use the first method (constant ISO adjustment), so that is what you will find in my spreadsheet of numbers below.

The methodology laid out, there are a few crucial points that must be addressed before the data are presented.

First is the people included in my data set. My data address only players who accumulated 300 or more plate appearances. With the exception of infield flyballs, pretty much all of the rest of the relevant xBABIP data stabilize by a half season's worth of plate appearances.

However, several players of interest were fewer than 15 plate appearances under the threshold (Desmond Jennings, Justin Morneau, Grady Sizemore, Chris Coghlan and John Mayberry) who I decided to add to the sample out of personal interest nonetheless.

Second, you are probably wondering how to use a different xBABIP formula (particularly slash12's) to get all the relevant numbers without having to do any additional, unnecessary work on your own. As a guy with a background in economics, I understand that desire to do the least amount of additional work necessary to capture the benefit sought, and accordingly, making an xBABIP formula adjustment is very easy with my spreadsheet.

All you need to do is change the formula in the xBABIP cell for the first player to reflect your favored xBABIP formula. Then, drag that cell down vertically to the bottom of the data set. Voila! All of the resulting changes and math will be done for you.

Finally, it is worth reminding you that the default xBABIP method used in my spreadsheet has slightly obsolete data (it's multi-year data from a couple of years ago) that is totally obsolete with respect to a few teams: The Mets, Yankees and Twins. With these three teams, you will need to mentally adjust the numbers to reflect the differential between these teams' old parks and their new ones.

Beyond just the limits of my particular data set, there is also an important assumption that underlies xBABIP that is critical to note. This assumption—which will be true of any xBABIP formula (well, unless that formula regresses a player's numbers towards some skill-based mean, which in and of itself would raise its own issues)—is that a player's xBABIP from year N will remain constant in year N+1. This is a bold assumption, and highly unlikely to be true in any single case.

xBABIP analyzes past luck based on past results, but it does not forecast the underlying elements that go in to figuring out the difference between skill and luck-based reality for future situations. To the extent a player's expected future walk rate, strikeout rate, groundball rate, flyball rate, infield flyball rate, line drive rate and home run rate—to name a few areas—could/will deviate next year from this year, xBABIP will not reflect those deviations.

Hence, if you think a player's line drive rate will increase in 2012 compared to 2011, then you should assume that his real expected future BABIP will be higher than his xBABIP. Let's call this difference nominal xBABIP and real xBABIP.

You should be particularly wary of players who had abnormally high/low home run rates last year. To the extent that home runs will increase or decrease in 2012, that will be a major factor that will impact the player's real versus nominal xBABIP figure. My spreadsheet calculates nominal xBABIP and makes adjustments accordingly. You will need to calculate or mentally adjust real xBABIP on your own.

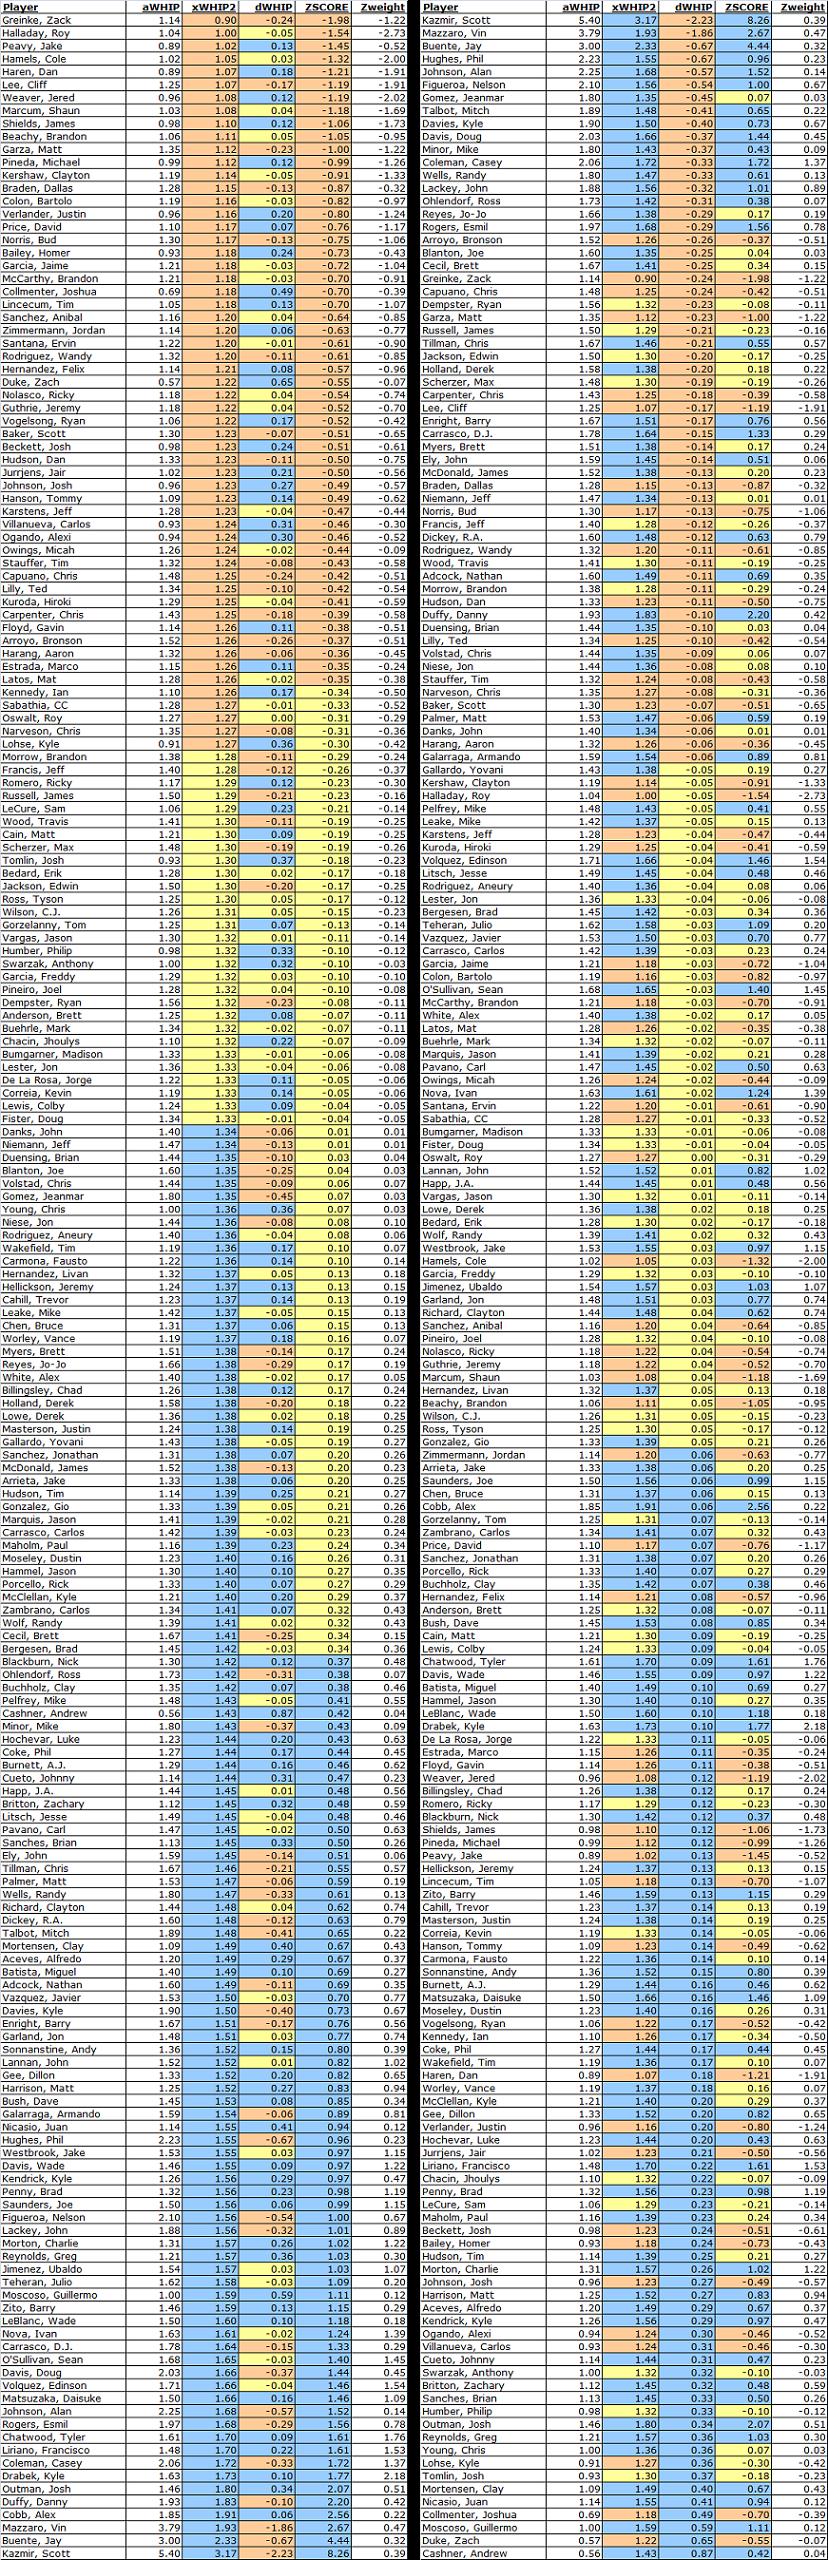
That said, let's look at the data. In case you have not already, you can download the spreadsheet by clicking here. If the column header has an "x" in front of the stat, it is xBABIP adjusted. If there is no "x," then that stat is the player's actual 2011 stat. For example, "AVG" is the player's 2011 batting average, whereas "xAVG" is his expected batting average based on xBABIP.

If the column header has a "d" in front of the stat, then it is a differential. For example "dBABIP" is the difference between a player's xBABIP and actual BABIP.

Looking through the 275-player spreadsheet, only 61 players (22 percent) have xBABIPs below their actual BABIPs, a testament to another year of excellent pitching and defense. The average actual batting average of the player sample is .267, while the average expected batting average was .281.

Clearly the data are a bit skewed on the high end. I tested the data set with slash12's xBABIP formula, and it also had an average expected batting average that was more than .10 points above the actual league batting average. Fewer than 30 qualified players had a batting average of or above .300 this year; xBABIP believes that that number should have been 42.

Turning to the data, let's first look at the "unluckiest" batters of 2011—those who are most likely to see the sharpest batting average improvements in 2012 (dBABIP greater than .050):
LastName       FirstName     Team             BABIP     xBABIP    dBABIP
Chone Figgins Mariners 0.215 0.314 0.100
Vernon Wells Angels 0.214 0.298 0.084
Rafael Furcal MULTIPLE 0.240 0.320 0.080
Chris Coghlan Marlins 0.263 0.331 0.068
Ian Kinsler Rangers 0.243 0.310 0.068
Russell Martin Yankees 0.252 0.318 0.066
Logan Morrison Marlins 0.265 0.328 0.064
Casey McGehee Brewers 0.249 0.313 0.064
Jonathan Herrera Rockies 0.273 0.337 0.063
Evan Longoria Rays 0.239 0.302 0.063
Alex Rios White Sox 0.237 0.299 0.062
Hanley Ramirez Marlins 0.275 0.337 0.062
Dan Uggla Braves 0.253 0.314 0.061
Ben Revere Twins 0.293 0.354 0.061
Ty Wigginton Rockies 0.271 0.330 0.059
Orlando Cabrera MULTIPLE 0.259 0.318 0.059
Adam Dunn White Sox 0.240 0.299 0.059
Jason Heyward Braves 0.260 0.318 0.058
Mark Teixeira Yankees 0.239 0.296 0.057
Jorge Posada Yankees 0.262 0.317 0.055
Miguel Tejada Giants 0.254 0.308 0.054
Juan Uribe Dodgers 0.245 0.299 0.053
Kelly Johnson MULTIPLE 0.277 0.330 0.053
Adam Lind Blue Jays 0.265 0.317 0.052
Wilson Valdez Phillies 0.288 0.338 0.051
Coco Crisp Athletics 0.284 0.335 0.051

As you might expect, a lot of the guys with some of the lowest batting averages in baseball populate this list. Those players, though mostly terrible, were not nearly as terrible as their batting lines from last year indicate. For example, Alex Rios was likely more a .260-.270 than a .227 hitter, and Adam Dunn should have hit closer to .200 than .159.

Mingled in with the bad players with bad luck last year, however, are a few really interesting names. The one that most stands out is Ian Kinsler, who I already explained could be a first-round caliber player next season. In addition to Kinsler are Evan Longoria and Hanley Ramirez. Long-time fans of the pair can take a cautious sigh of relief if they were worried about spending a third-round pick on either. Mark Texeira is on this list, but I am more skeptical than I am with Ramirez and Longoria that he can bounce back to previous batting average form.

The most shocking name on this list might be Chone Figgins, who seems to be at the end of his career after a .302 wOBA (88 wRC+) last season and a putrid .218 wOBA (34 wRC+) this season. xBABIP thinks Figgins should have hit .273/.321/.332 (.653 OPS) this year, which would have been about league average by wOBA standards once park factors are considered.

Figgins' bat is pretty hollow in real life, but as a perennial base-stealing threat when he gets on, it is encouraging to see that Figgins still has the potential to get on base 33 percent of the time. Figgins' walk rate this season plummeted to a career-low 6.7 percent after four seasons of a walk rate above 10 percent, so some bounceback could be imminent just from regression. This noted, Figgins could be a sleeper source of stolen bases next year.

Next, the 26 "luckiest" batters of 2012 (dBABIP less than -.015), who are most likely to see the sharpest batting average declines in 2012:
LastName       FirstName     Team             BABIP     xBABIP    dBABIP
Wilson Betemit MULTIPLE 0.391 0.323 -0.068
Adrian Gonzalez Red Sox 0.380 0.333 -0.047
Nick Hundley Padres 0.362 0.317 -0.044
Alex Avila Tigers 0.366 0.326 -0.041
Miguel Cabrera Tigers 0.365 0.324 -0.041
Hunter Pence MULTIPLE 0.361 0.322 -0.039
Chase Headley Padres 0.368 0.329 -0.039
Jose Reyes Mets 0.353 0.319 -0.034
Matt Kemp Dodgers 0.380 0.345 -0.034
Daniel Murphy Mets 0.345 0.311 -0.034
Victor Martinez Tigers 0.343 0.309 -0.034
Nyjer Morgan Brewers 0.362 0.329 -0.032
Jemile Weeks Athletics 0.350 0.320 -0.030
Michael Young Rangers 0.367 0.337 -0.030
Lucas Duda Mets 0.326 0.297 -0.029
Alex Gordon Royals 0.358 0.331 -0.027
Jhonny Peralta Tigers 0.325 0.300 -0.025
Dustin Ackley Mariners 0.339 0.316 -0.023
Andre Ethier Dodgers 0.348 0.326 -0.023
Carlos Beltran MULTIPLE 0.324 0.302 -0.021
Mike Napoli Rangers 0.344 0.323 -0.021
Joey Votto Reds 0.349 0.329 -0.020
Ryan Raburn Tigers 0.324 0.305 -0.020
Casey Kotchman Rays 0.335 0.318 -0.017
Michael Morse Nationals 0.344 0.328 -0.016
Ryan Braun Brewers 0.350 0.334 -0.016

As mentioned above, only 22 percent of the players in the sample overperformed their expected BABIP in 2011. This is likely due to the returned recognition of value provided by athleticism and defense in the post-Moneyball era, along with better pitching league-wide.

Unsurprisingly, the "luckiest" batters tend to be the guys who competed for the batting title, and in this regard we find the names Matt Kemp, Adrian Gonzalez, Victor Martinez, Miguel Cabrera, Jose Reyes, and Ryan Braun mingled into the list.

This does not mean that these players are per se guys to avoid next year; they are still great. Their inclusion on this list simply means that their value will be inflated above their luck-neutral talent line. An inflated batting average through BABIP luck tends to lead to extra runs and RBIs, as well as stolen bases, by virtue of the law of opportunity.

Some of the interesting non-elite names on the luck list are second basemen Jemile Weeks and Dustin Ackley. Second base was surprisingly deep this year. Per Yahoo's end of season player rankings, four of the top 26 players were second-base eligible, while seven of the top 100 players were second basemen. With both second base rookies poised to see their averages drop precipitously next season, it is quite possible second base might not be as bountiful next year.

Alex Avila also resides on this list. While his .295 batting average may not be for real, his 15-20 home run power is. The same can be said about Mike Napoli, who is really a .260 hitter with 20-30 home run power depending on playing time.

Of all the names on the list, however, I think Alex Gordon might end up being the most overrated for 2012. As a long-time Gordon supporter and well-rewarded 2011 owner, it pains me to call the guy overrated after years of him not getting a proper chance, but Gordon is not a .300/20/20 player.

Rather, he is more a .275-.280 hitter capable of a low .800s OPS with 20 home run capability and double-digit stolen base potential. A .280/20/13 campaign may be in the cards, but you'll likely be paying a premium over that level to acquire him next year in non-keeper formats. It is also worth noting that Gordon loses his third-base eligibility next year, which will also negatively affect his fantasy value.

So who are some names on the BABIP luck list that most shocked you? Who do you think is least likely to match his expected batting average?

As always, leave the love/hate in the comments below.

Is David Wright Overrated?

Recently, someone in one of my fantasy leagues proclaimed that he felt David Wright was overrated*. His claim was that Wright never returned his draft day value, that he never lived up to expectations, that he is a perpetual injury risk, and that he was not worthy of a top 10, let alone first round, pick.

*This statement was made amidst trade talks, so perhaps the comments need to be taken with a grain of salt in light of the inevitable "all my players are awesome, while all of yours have some marked flaw" back-and-forth that predicates trading.

Naturally, I dismissed these claims as outrageous, but in trying to trade Wright at various points this season, I have perpetually encountered concern about his production potential and value as a real life and fantasy asset. It leads to me wonder whether Wright is being undervalued, or whether I have put the man who has been on each of my squads since I began playing fantasy on a nostalgic pedestal.

The first thing one might notice upon glancing at Wright's player stats page is his 162-game average pace numbers: 27 home runs, 22 stolen bases (to six caught stealing, for a 78.6 percent success rate), 103 runs, 107 RBI, .303/.382/.513 (.895 OPS, .386 wOBA, 137 wRC+).

While Wright has never played 162 games in a season, he did average 155.8 games between 2005 (his first full season as the Mets' starting third basemen) and 2010, including his concussion-shortened 2009 season (144 games played). From 2005 to 2010, Wright thrice played 160 games, appearing in 154 of the Mets' contests in each season other than 2009. In fact, Wright's first disabled list stint came in 2009, after he was beaned in the head by a 94 mph Matt Cain fastball—something you can hardly call a "chronic" health issue. Back problems are always a worry, but this is the first time Wright has had one, and his disabled list stint this year was only the second of his career.

So much for being a perpetual injury risk.

And what about his production? Is it overrated? Wright has exceeded the 162-game pace noted above only once in his career, in his 2007 30/30 campaign, but has produced at an elite level each season of his career.

Between 2005 and 2010, Wright hit fewer than 26 home runs only once—in 2009—and he stole 15 or more bases each of those six seasons. His career low batting average entering this season was .283, while it was only once under .300 before 2010, when he posted a .293 batting average in his inaugural season (2004).

In terms of Wright's relative value, among the 128 players to accrue enough plate appearances between 2005 and 2010 to qualify for at least one batting title, Wright's value over the average player value ranks fifth overall, with a 5.70 Z-Score. Only six players had a Z-Score of five or higher, and the four guys ranked ahead of Wright—Albert Pujols (8.91), Alex Rodriguez (6.72), Miguel Cabrera (6.23), Matt Holliday (5.73)—were undeniably better from 2005-2010 (though position was not considered for these crude Z-Scores). Furthermore, If you combine his partial 2004 season with his 2011 partial season (125 games played), Wright's composite line would be 23 home runs, 14 stolen bases, and a .283 batting average.

Perhaps it is unfair to combine Wright's first and last seasons, as he has been a different hitter since his injury, striking out more frequently and hitting for a little less power. Nonetheless, Wright's composite 2010 and 2011 numbers (212 games) are still quite strong. Since the beginning of 2010, Wright has hit .280/.354/.491 with 38 home runs and 28 stolen bases. That prorates to a 27.5 home run, 20.5 stolen base rate per 155 games played. Furthermore, Wright's walk rate of 10.7 percent in this span is not too far off his career 11.2 percent mark (11.8 percent 2011 mark).

Thus, even with "diminished" batting average and slightly down power (Wright averaged 29 home runs a season between 2005 and 2008, hitting 30-plus in 2007 and 2008), Wright's level of production has not diminished so far as to call his present production disappointing. Citi Field's effects must also be considered, as the park robbed Wright of at least six home runs in 2009.

Let's be realistic/pessimistic for a moment, and presume that Wright's present pace represents most of his true talent line going forward, and that his "true talent" line was "only" a .280/25/15 pace. Let's also ignore positional value, despite the scarcity of production at third base this season. How do those numbers stack up in fantasy?

From 2005 to 2010, only four players averaged 25-plus home runs and 15-plus stolen bases per season: Alex Rodriguez, Alfonso Soriano, Chase Utley and Wright. That is exclusive company.

More specifically, from 2005 to 2010, there were 57 individual seasons of 25 home runs and 15 steals, or just under 10 per season (some seasons had a couple more, some a couple less, but no season had more than 12 players hit 25/15). Of these 57, only 12 players owned more than one, while only three players (A-Rod, Soriano and Wright) could lay claim to three or more. Wright is the only player to post five 25/15 campaigns over that six-year span.

Even more interestingly, only 24 of those 57 25/15 campaigns involved a player posting a batting average of or above .300. Of those 24, four were turned in by Wright. If we try to stack "present Wright" batting average in the mix, he would still have a better batting average than 16 percent of our sample. You can investigate more 25/15 trends from 2005 to 2010 by clicking here (Excel file).

Balance is an underrated asset in fantasy baseball. Diversification, rather than absolution, mitigates risk by reducing the effect of disappointment by any single player. A squad of fantasy players that average 15+/15+ is just as capable of competing for a fantasy title as a team built with one- and two-trick ponies like Juan Pierre and Ichiro Suzuki. Brad Johnson's fantasy squad in The Hardball Times Fantasy League this year, and my various teams in other leagues, are living, present day testaments to this. The real difference between the two constructs is that the 15+/15+ team's first place dreams are probably not sunk when any single player goes down. Compare the effects of losing, and problems with replacing, a dud like Pierre (50-60 expected stolen bases) to replacing a random 15+/15+ player when the average major league hitter averages something like 12 home runs and nine stolen bases.

So what does this all mean? It means that Wright is not overrated. He is routinely one of only 10 players a season that you can bank on hitting 25 home runs and stealing 15 or more bases, while hitting .280 with batting average upside. In addition to elite production, Wright plays at one of baseball's increasingly premium fantasy positions—third base.

While his declining defense may be a concern for Mets fans, most fantasy formats do not consider defense, and there are no signs that Wright is ticketed to move off the hot corner. He is currently on pace for 25 homers and 25 steals per 155 games this season, and has been red hot since returning from the disabled list. All this after a bounce-back power season last year (29 home runs) after a disappointing longball output in 2009, which was arguably deflated by both park effects (Citi Field has since undergone substantial changes) and a fluke concussion caused by a man whose skill eludes sabermetricians.

So next time someone in your league tries to tell you David Wright is overrated, tell them they are wrong. Heck, try and trade for him if this myth is that permeating.

Rasmus The Blue Jay

My latest article for The Hardball Times is up, analyzing Colby Ramsus' future as a Blue Jay. Enjoy. As always, the chart data prevents me from posting it here.

Danny Duffy: The AL's Covert Ace

My latest article for The Hardball Times takes a look at Danny Duffy's past five starts, compares them to his first six starts, and postulates whether it's Duff Time.

Javier Vazquez: Second half breakout candidate

The following is my latest article for The Hardball Times.

All stats current through July 7.

Javier Vazquez | Marlins | SP | 25 percent Yahoo ownership
YTD: 5.64 ERA, 1.56 WHIP, 6.25 K/9, 1.82 K/BB, 32.2% GB%
Oliver ROS: 4.29 ERA, 1.33 WHIP, 7.7 K/9, 2.75 K/BB


What a fall from grace Javier Vazquez's steep and sudden decline has been. A notorious and perpetual sabermetric darling for his career, the prototype for Ricky Nolasco always put up great peripherals that never seems to match his surface stats. Some, if not most, of the gap may have been ballpark and defensive effects, however.

From 2004 to 2008, Vazquez, a flyball pitcher by trade, played in some pretty offense-inflating and home run-inflating ball parks in front of some of baseball's poorest defenses. In 2004, he played for the Yankees, who collectively posted a major league-worst team UZR total of -75.9 runs.

The 2005 season was no different, as Vazquez pitched for the third-worst defensive team in baseball, the Diamondbacks, whose -48.8 team UZR hardly offset the environmental effects of a park that used to bolster offense much more half a decade ago than it does now.

And then, of course, Vazquez famously pitched for the White Sox at US Cellular Field, one of baseball's most home run-inflating ballparks, between 2006 and 2008 before the team traded him away for Tyler Flowers and Brent Lillibridge. (Hey, at least it's more than what they got when selling Nick Swisher, who they gave up Gio Gonzalez (again) to acquire).

Though Vazquez had a solid season of results for the Sox in 2007 (15 wins, 3.74 ERA, 1.14 WHIP, 213 strikeouts over 216.2 innings pitched), his results overall were largely poor (627 innings of league-average 4.40 ERA baseball) and "unclutch" (-3.80 Clutch rating between 2006 and 2008).

Vazquez's tenure on the White Sox only saw his bad-park, bad-defense meme continue. From 2006 to 2008, perhaps largely because of Jermaine Dye (aka "Life To Flying Things"), the White Sox's -80.5 cumulative team UZR ranked fifth-worst in baseball ahead of only the Yankees, Dodgers, Diamondbacks, and Pirates.

Regardless of the results, from 2004 to 2008 Javier Vazquez's underlying peripheral performance remained strong and ranked well amongst his peers. Not only did his peripherals indicate a better-than-his-results pitcher, but Vazquez was also one of baseball's most durable.

From 2004 to 2008, Vazquez's innings pitched total of 1041.1 ranked ninth overall amongst all pitchers who played at least one game during that span. Only Johan Santana (currently on the DL), Brandon Webb (currently on the DL), Roy Oswalt (currently on the DL), Mark Buehrle, Livan Hernandez, CC Sabathia, Jon Garland (currently on the DL), and Carlos Zambrano (currently on the DL) pitched more innings during that span.

Over those 1041.1 innings, Vazquez punched out 939 batters while only walking 273, for an elite strikeout-to-walk ratio of 3.44 (2.00 MLB average). Amongst the 153 pitchers to toss 400 or more innings between 2004 and 2008, Vazquez's 21.4 percent strikeout rate (16.7 percent MLB average) and 8.12 K/9 rate both ranked 18th overall, while his 6.2 percent walk rate (7.6 percent MLB average) was the 29th lowest. His 1.26 WHIP was also 26th-best in the majors.

Despite posting the 34th-worst groundball rate (39.6 percent) amongst this sample of pitchers, Vazquez's nonetheless owned the 27th-lowest xFIP (3.85 xFIP, 87 xFIP-) of those 153 pitchers.

In 2009, then, perhaps it should come as no surprise that Vazquez was one of baseball's best pitchers. Not only did he move from the DH-laden American League to the senior circuit, a move that tends to cause a pitcher's K/9 rate to spike by +0.57, and his ERA to decrease by approximately 0.41, but for the first time in his career, Vazquez was pitching in a offense-neutral park that slightly suppressed home run production in front of a middle-of-the-league defensive team.

As might be expected, Vazquez had a career year, producing a career-best 9.77 K/9 rate, a career second-best 1.81 BB/9 rate, and a career-best xFIP and FIP (both 2.77) that were only slightly below his career-best ERA of 2.87. Vazquez rewarded fantasy owners with 15 wins and career-best 1.03 WHIP.

Among the 130 pitchers who threw 100 or more innings in 2009, no one posted a lower xFIP than Vazquez, not even Cy Young winner Tim Lincecum, whose 2.83 xFIP was the only other xFIP in baseball below 3.00 that season. Vazquez's 9.77 K/9 rate ranked sixth-best in the majors amongst all pitchers with 100 innings in 2009, his walk rate was eighth-best, and his 5.41 K/BB ratio was second only to demi-gods Roy Halladay (5.94) and Dan Haren (5.87).

Not to humble brag, but as someone who drafted Yovani Gallardo, Dan Haren, and Vazquez that season (not to mention acquiring Zack Greinke in early April), you can imagine my productive year in fantasy. Alas, I digress.

Not only was Vazquez a great pitcher in 2009, but his 219.1 innings (32 starts) that year continued his legacy of durability. That year marked his 10th consecutive season of 32 or more starts, averaging 216 innings per campaign over that span and failing to top the 200 innings mark only once with a "mere" 198 innings in 2004.

Though 34 years old entering the 2010 season, few, if any, pitchers seemed more durable with better stuffs—especially on the free agent market—and the Yankees took notice. They shipped off quality starting pitching prospect Arodys Vizcaino (and Melky Cabrera) to the Braves in order to give Vazquez a second-chance at proving New York and the AL East was not "too tough" a place for him to pitch.

Vazquez's flyball tendencies and New Yankee Stadium's first year home run-happy exhibition indicated that Vazquez was unlikely to duplicate his 2009 success for New York's Bronx Bombers in 2010, but a strikeout rate above eight batters per nine, a sub-4.00 ERA, and top-notch K/BB ratio were to nonetheless be expected. No one could have predicted what happened next, as the wheels to came off—fast. Even Andruw Jones' meteoric fall from grace took a couple of seasons to occur.

Not only did Vazquez's move from the NL back to the AL—and from Turner Field to New Yankee Stadium—cause some regression, but Vazquez completely came apart as a pitcher. His average fastball velocity, which consistently sat between 91.1 MPH and 91.8 MPH from 2005-2009, plummeted to 88.7 MPH in 2010. In only one start, in fact, did Vazquez's fastball even average 90.

Fastball velocity is highly correlated to strikeout rates, ERA, FIP, and batting averages against, so perhaps Vazquez's loss of 2.5 MPH of stink off his cheese (food metaphor!) explains his then-career-low 6.92 K/9 and career-worst FIP/xFIP marks. However, walk rates are not very affected by changes in velocity, so there must have been something else at play, perhaps a hidden injury (Vazquez ultimately did spend time on the DL in 2010) if we are to explain a career-high 3.72 BB/9.

At the least, with a 5.64 ERA and 1.40 WHIP over a near career-low 157.1 innings, the Yankees did not get what they bargained for by giving up Vizcaino. So they let him walk and wisely did not offer arbitration.

Now there were several teams out there this preseason willing to give Vazquez another chance, given his history, on various one- or two-year deals. Dave Cameron showed us that history indicated it was unlikely for Vazquez's fastball zip to return, and that perhaps we all underestimated the wear-and-tear that over 42,000 pitches and 2,647.1 innings had taken on Vazquez's arm over 13 seasons.

Nonetheless, despite all the red flags, the Marlins were willing to give Vazquez—who wanted to rebuild his stock and felt comfortably familiar with the Marlins organization—a flier on a one-year, $7 million deal that was reportedly lower in both years and money than what other teams were willing to pay.

That history brings us to this season, where Vazquez has produced a 5.64 ERA, a career-worst 1.56 WHIP, and 4.62 xFIP to date in an era where the league average pitcher has an ERA, FIP, and xFIP all in the high threes. This investment has hardly paid off thus far for the Marlins, as Vazquez's strikeout rate (6.25 K/9) has continued to decline, while his walk rate (3.43 BB/9) remains inflated.

Despite all this ugliness and recent history, however, there are several reasons for the Marlins and frugal fantasy owners to find solace in Vazquez in the second half.

First and foremost, Vazquez's velocity (2011 average to date is 89.5 MPH), which is still down below his career rate of 90.9 MPH and his 2005-2009 velocity range, is up from last year. More importantly, however, his fastball velocity has been averaging in the low 90's his past five outings. Recent fastball velocity tends to become relevant and reliable very quickly (after about three outings), so this could be a great sign for Vazquez the rest of the way.

In addition to a rekindled fastball of late, Vazquez also has rediscovered his control over his past 10 outings. Since May 9, Vazquez has tossed 54 innings and only walked 12 batters (and of those 12, only 10 were unintentional) for a walks-per-nine rate of 2.00 on the button. Meanwhile, Vazquez has punched out 46 batter (7.67 K/9) for a 3.83 K/BB rate that accords with Vazquez's 2004-2009 performance.

While walk rates take approximately a year and a half to stabilize, unintentional walk (half a season) and strikeout rates (one-fifth a season) stabilize much faster. Vazquez's full season unintentional walk rate of 2.92 this season is not too far off his career rate of 2.55, and a substantial improvement over last year's disaster rate of 3.89.

Vazquez remains an unashamed flyball pitcher this season (32.2 percent groundball percentage in 2011, 34.9 percent in past 10 years), but if we plug his past 10 starts worth of data into the latest version of the xWHIP Calculator, calibrated to the 2011 run environment, we get a good picture of the quality of his recent performance:

image

Noting that the eFIP and xWHIP league averages are approximately 4.00 and 1.33, respectively, it is clear that Vazquez has performed substantially more like his former self of late than his season ERA/WHIP or even past 10 starts ERA/WHIP (4.83/1.35) indicate.

Vazquez may not be one of baseball's thirty best pitchers anymore, and thus no longer an ace, but if he can continue his recent performance, a sub-4.00 ERA and strong WHIP with good strikeout totals could be in the cards. And if Hanley Ramirezcontinues to play like his former self as he has of late (past 12 games: 16-for-45, five walks, three HR, one SB, 12 RBI, nine runs), then a healthy wins total could also be coming for the disgraced starter.

Unless you are in a deep (14-plus teams) or NL-only league, chances are that Vazquez is available for free (or a $1 FAAB bid) in your league's free agency pool. While I cannot recommend starting him just yet, he is certainly worth the pickup for your bench and worthy of the type of monitoring that would require a compelling government interest.

Vazquez is likely a matchups-only play at the moment (though it is worth noting that most of his recent ten outings came against offense-heavy teams), but is equally as rosterable as, if not more so than, Rich Harden.

Keep a close eye on Vazquez after the All-Star break. He could be a second-half Josh Beckett- or Bartolo Colon-like value.

Recommendation: Javier Vazquez should be owned in NL-only leagues and at least bench-owned in 12-plus-team mixed leagues. Ten-team mixed leagues can ignore Vazquez for now, but should monitor his next five starts closely.

As always, leave the love/hate in the comments below.

2011 Home Run Derby Stats

Check out my latest article at The Hardball Times by clicking here. I've tried posting the data/info here, but it will not format properly for our interface. Sorry.

The article is a compilation of break-down statistics of each home run derby contestant's power numbers, home run stats, and a map of what their home numbers would look like at Chase Field.

FAAB Budgets and the Discount Factor

The following comes from my latest article for The Hardball Times.

Every year, big names fall on the waiver wire. Be it a prospect call-up, a frustrated owner prematurely cutting ties (e.g., what I did with Madison Bumgarner this year), a move of desperation in light of shallow benches and deep injuries (e.g., the "perfect storm" league where I own Hanley Ramirez, Joe Mauer, David Wright, Pablo Sandoval, Jason Heyward, Ike Davis, Brandon Beachy, Josh Johnson and former DL pains Brian Matusz and Geovany Soto, or some other occurrence, an economic game of how much to spend on whom and when inevitably results.

So how much do you spend on Eric Hosmer, an early elite prospect call-up? Or Jerry Sands, a supposed impact player of a less-elite level? Or what do you do if Anthony Rizzo and Mike Moustakas are both sitting on waivers after their call-ups last week (some leagues play where you cannot own or bid on a player until they have one game under their belt)? Do you wait for Brett Lawrie and Dustin Ackley?

The answer is never a clear one, and I cannot give you a simple answer. FAAB bid recommendations are a lot like snowflakes. Value is infinitely complex and unique, and it depends on the size of the league (12 teams? Five outfielders?), the format of the league (mixed? AL-only?), the depth of benches and DL spots, and your team's current standing in your league.

What I can tell you, however, is that the timing of the FAAB bid makes a major impact on the expected return of the player, and that timing is rarely considered a factor.

One of the more distinct concepts I can still recall from my days as an undergrad studying economics is the discount factor. Put simply, a discount factor, often an interest rate, accounts for the difference between present and future value. A dollar now is never (okay, maybe almost never, as deflation/stagflation does exist sometimes) worth a dollar in the future.

Let's say, for example, the bank pays five percent interest on your CD account, and that you can open a CD account with any balance. If you begin in year N with X amount of money, and you put that money in the beginning of year N into that CD account, it will grow in value to X*1.05 dollars. In other words, the future value of X is 1.05X.

Conversely, we can evaluate the value of future money now by looking at the same interest rate. Instead, suppose that you will have Y dollar in the future, say because of an impending lawsuit settlement. You cannot have the money from the source now, but will have to wait one year.

If you want to figure out either how much money you would need now to attain Y in one year by putting said money into the CD account noted above (or alternatively how much you should sell the rights to collect on your settlement for), you just need to do the math from above in reverse. If present value (P) times interest rate (R, here five percent) equals future value (again, Y), then Y = 1.05P, or the present value is Y/1.05.

As you will notice, with the denominator being larger than one, present value is lower than the future value. That may seem simple enough, but it is a powerful thing to note that is often ignored in trading and FAAB budgets.

It is to say, alternatively, that a transaction worth Z today is more valuable than a transaction worth Z in the future; that trading for Prince Fielder today is more valuable than doing so in two weeks, and that bidding on Hosmer now is better than bidding the same amount on Anthony Rizzo in the future, even if you think both players are equally valued.

So what does this all mean? It means that shelling out FAAB money on Hosmer in the beginning of May is more valuable than shelling out a similar sum on Rizzo in the beginning of June. The season is only 162 games long, and every day you wait, your opportunity cost is approximately 0.6 percent of potential value.

This 0.6 percent figure could and should be thought of as a discount rate applied to a player's expected production in evaluating FAAB money. It means that a worse player today could be worth more than, or equal value to, a better player who will not be on waivers until some period in the future.

Let's use Rizzo and Hosmer as an example in comparative bidding, and begin by assuming that the two are roughly equal in rate value (production per game). Both are highly-touted, power-hitting prospects that play in offense-suppressing parks with comparable-enough 2010-2011 minor league numbers.

Hosmer was called up about 35 days earlier than Rizzo. If each player, over a comparable sample of plate appearances, is roughly equal to X dollars of production, Rizzo's late call-up induces a penalty value of -15.4 percent. In other words, if you think Rizzo is worth a FAAB bid of X, then your bid on Hosmer should be approximately 15 percent larger than what you would bid on Rizzo.

As the expected waiver pool thins, there is also a scarcity premium that should be considered. Imagine that by the All-Star Break, all of Domonic Brown, Hosmer, Rizzo, Moustakas, Ackley, and Desmond Jennings have been called up.

That could leave Lawrie as the lone "impact" hitting prospect of great consideration that you can count on to be on the big league roster getting a healthy series of playing time. If Lawrie is worth X to you at his call up time, then you better bet more than X, particularly if it is a hard-to-fill position like second, shortstop or third.

This might all seem simple in form, but timing truly is an overlooked value concept in fantasy baseball, where we preach patience.

On one hand, we say "ride out his slump" and caution blowing all your FAAB budget on the first day of the season to acquire a huge prospect like Heyward or Michael Pineda. On the other hand, as noted above, every day you wait is another day the impact of the move you seek to make loses some gravity of impact.

A lot of owners bid conservatively on Hosmer in my leagues, whom I won on every FAAB bet I could place for under $70, because, as they relayed to me, why overbid now when there are comparably valuable players looming out there, some who play premium positions, such as Rizzo, Moustakas, Lawrie, and Ackley (who, in my eyes, is just Kelly Johnson with less power and a bit more batting average). "Why throw away $70 on Hosmer when I know I can probably win Rizzo for less?" one owner relayed to me.

The answer is all of the things I have said above. With Hosmer off the board, there is one less prospective impact player on the waiver wire. You also get Hosmer, even if inferior to Rizzo, a whole month earlier. Particularly if you were employing Luke Scott or Ike Davis at first entering May, having Hosmer today over Rizzo in the future could mean the difference between a league title and another disappointing finish.

HR/OFFB% Park Factors

The following comes from my latest post on The Hardball Times. Because of the width of our site, to get 4-year home run per FLYBALL park factors, you'll have to go to my above link to THT.

A couple of years ago, former THT writer Dan Turkenkopf tabulated an index of single-season (2009) and four-year home run per fly ball (HR/FB) park factors. I have griped plenty about using HR/FB rates over home run per outfield fly ball (HR/OFFB) rates in tabulating xFIP many times in the past, most recently last week, because HR/FB rates include pop-ups (IFFB), which can never be home runs. The data, over large samples, may be insignificant in difference overall, but why use bad data and skew the margins? It's like Fangraphs' incomprehensible decision to use strikeouts per at-bat (K/AB) instead of strikeouts per plate appearance (K/PA) to calculate strikeout percentage*. (Dave Cameron has indicated that recalibrating Fangraphs' database would likely be a cumbersome process.)

*Here are two examples why Fangraphs' K% calculations, done as K/AB, make no sense. First, assume player X has a particular K/PA in year N. In year N+1, he maintains the same K/PA rate, but increases his walk rate. Though his K/PA remains stable, Fangraphs would report his K% as having "increased," imparting negative stigma and poor analysis by persons who are not aware that K%, not on the same scale as BB% (calculated as BB/PA), does not per se indicate actual strikeout skill. Likewise, players with higher walk rates exhibit disproportionately high strikeout rates.

Ryan Howard, for example, has a career K% of 31.9 percent on Fangraphs, but has only struck out in 27.5 percent of his total plate appearances. For Howard, who strikes out a lot, this may not matter or make much of a difference if you analyze him, but for a player like Prince Fielder (career 22.1 percent K%), it does. Fielder has struck out in only 18.6 percent of his total plate appearances. On the surface, it would seem as though Brennan Boesch (20.4 percent K%) and Ryan Braun (20.5 percent K%) are "noticeably" better at avoiding strike three, but are in reality substantially the same, owning respective K/PA rates of 18.1 and 18.4 percent for their careers.

Other high walk "strikeout" sluggers, such as Geovany Soto, have K/PA rates that are lower than low-walk players with lower K% rates. Some say "well you can't strike out in a walk, so why use plate appearances in the denominator," but you also can't strike out in a hit or walk in a strikeout, and yet we accept plate appearances as the denominator for walk rate (BB%). Plus, just logically, shouldn't K% represent how likely a player is to strike out when he comes to the plate? Why make Shin-Shoo Choo's year-to-year K% like comparing apples to oranges because of a fluctuating walk rate?


Particularly where your data has an abnormal pop-up rate, HR/FB-tabulated xFIP loses a lot of its value. In fields like Oakland where there is a lot of foul territory, and in parks like Wrigley, where there is practically none, the differences in HR/FB and HR/OFFB rates might make a difference. The difference may be a couple of home runs at most (park factors only apply, in theory, in a half-step, as a player's expected number of home games is just 50 percent), but in a game of inches, such could affect Z-Scores, data distribution, etc. If memory served, HR/OFFB has also shown to be less volatile year-to-year than HR/FB.

Because I have such a penchant for HR/OFFB-based calculations, including them as a data point in my xWHIP Calculator, I asked a favor of Dan, who has in turn tabulated an index of HR/OFFB rates by ballpark using data from 2006-2009. We did not have the necessary 2010 data offhand to tabulate 2007-2010 rates, but hopefully this offseason we will be able to plug in 2008-2011 data for a fresher version of these numbers.

As with Dan's 2009 post on HR/FB park factors, certain parks have less data, are weighted similarly (but without the same old data to affect the weights), and may not be as reliable. The data below regards old Twins Stadium (the Metrodome), while the Mets' and the Yankees' Park Factors are from one season only. The Nationals' Park Factor also only uses two seasons worth of data, and is weighted at 5 and 3. All other parks feature four-year weighed factors of 5,3,2,1.

Without further ado, here is the goldmine of data you've probably always wanted, but never had (at least not that I was aware of) until now, ranked from most-to-least home run inflating per outfield fly:
Team              Park                         LG    4-Year HR/OFFB
Yankees New Yankee Stadium AL 120
Reds Great American Ballpark NL 116
Rays Tropicana Field AL 114
Orioles Oriole Park at Camden Yards AL 113
White Sox US Cellular Field AL 113
Rockies Coors Field NL 111
Astros Minute Maid Park NL 110
Brewers Miller Park NL 108
Marlins Dolphins Stadium NL 108
Blue Jays Rogers Centre AL 107
Cubs Wrigley Field NL 104
Mets Citi Field NL 104
Angels Angel Stadium AL 102
Diamondbacks Chase Field NL 100
Rangers The Ballpark at Arlington AL 98
Giants Pacific Bell Park NL 97
Red Sox Fenway Park AL 97
Tigers Comerica Park AL 96
Phillies Citizens Bank Park NL 93
Pirates PNC Park NL 93
Athletics McAfee Colisuem AL 92
Dodgers Dodger Stadium NL 92
Mariners Safeco Park AL 92
Braves Turner Field NL 91
Nationals Nationals Stadium NL 91
Twins Metrodome AL 88
Indians Jacobs Field AL 87
Royals Kaufman Stadium AL 86
Padres PETCO Park NL 79
Cardinals Busch Stadium NL 76


Thanks again to Dan Turkenkopf for crunching the numbers for me. As always, leave the love/hate in the comments below.

Disproving The Myth Of Dan Haren

The following is my latest article for The Hardball Times, and another entry in a long series of posts about my man crush on fantasy ace Dan Haren.

All stats are current through June 14.

There are many popular memes about "partial-season" players in baseball. Adam LaRoche and Mark Teixeira can't hit in the first half. Kosuke Fukudome can only hit in April, while CC Sabathia can't pitch in April. And, of course, the one that inspired this writing, the notion, largely perpetuated by Matthew Berry and the folks at ESPN, that Dan Haren can't pitch after the All-Star break.

Some of these myths have some result-based credence to them (Teixeira, for instance, has a career slash line of .237/.348/.427 in April (.775 OPS), whereas his career OPS marks in May, June, July, August and September are all above .900), but do they, particularly the Haren one, have "predictive" substance behind them?

First, let's look at the pitcher Haren has been for his career. In short, he has been about as consistent and elite a pitcher as there is. Over the course of his eight-plus years in the major leagues (2011 is his ninth), Haren has proven to be very durable—pitching 216 or more innings each of the past six years, and on pace to do so again this year—and has compiled a 3.59 ERA and 1.18 WHIP along with 1338 strikeouts to only 339 walks over 1561 major league innings.

On the peripheral level, the surface checks out, as validated by a 3.60 FIP, a 3.55 xFIP, a 3.84 tERA (this tends to be a higher figure than FIP, though scaled to look like ERA), and a strong strikeout rate (20.7 percent K rate versus an 18.0 percent MLB average) that comes from the ability to induce a good number of swings-and-misses (career 9.7 percent swinging strike percentage, MLB average is 8.4 percent).

Even his batted-ball normalized numbers check out, as Haren's expected WHIP and eFIP check in at superior rates of 1.23 and 3.69, respectively.

Haren is also a relatively neutral batted ball-type pitcher (career 1.20 GB/FB ratio, 0.78 GB/AO ratio) who has played in relatively neutral home run-inflating parks (Angel Stadium, with a home run-per-outfield fly ball (HR/OFFB) park index of 102, is the most home run-inflating park of his career), though he has never experienced any type of home run luck (career 11.5 percent HR/OFFB percentage, 11.3 percent MLB average).

As a flyball-neutral pitcher with good strikeout rates and low walk rates, there are very few, if any, holes in Haren's game. More inspiring, however, is Haren's consistency. Since his breakout year in 2007, Haren's relative ERA indicies have been as follow: 138, 139, 142, 106*, 148.

*Though Haren's BABIP-inflated first half ERA+ was 93, his second-half ERA index was 139.

All in all, with Haren, what you see is what you get, and you tend to get what you paid for.

In Roto leagues, full-season expectations are everything, but in H2H leagues, or micromanaged Rotisserie leagues, splits are important. As any Alex Rios owners last year can tell you, as much value as a player puts for in the first half, irrespective of his end-of-season line, if his second half is nerve-wrecking, not only can he make you forget all the good he did for you, but a front-loaded player can cause you to nose-dive from the top of your league's standings.

Noting how great Haren's end-of-season statistics have been over the past half-decade of baseball, let's investigate whether or not he truly is one of these "front-loaded" players you need to deal rather than hold.

First, the results. Per Baseball Reference, Haren's second-half results have not been up to par with his first-half surface stats. Though Haren is the owner of a robust 3.21 ERA and 1.09 WHIP with 751 strikeouts to 181 walks (4.15 K/BB ratio) over 880 innings pitched in the first half for his career, his career second-half numbers clock in at a 4.07 ERA and a 1.30 WHIP with an equally good 7.8 K/9 ratio (587 strikeouts over 680.1 innings pitched), but more walks (158, for a 3.72 K/BB ratio).

Now, a 4.07 ERA and 3.72 K/BB is not horrible (keep in mind the league-average ERA and K/BB over this period were approximately 4.40 and 2.00, respectively) nor something to sneeze at, but in light of his career end-of-season numbers and stellar first-half numbers, you can understand why owners generally want to sell Haren by July.

But is this "sell, sell, sell" attitude particularly warranted, despite the results? Or does it breed a market inefficiency that you can exploit to your advantage? Because we at The Hardball Times are bigger fans of inner, rather than outer, beauty, let's dig a little deeper into Haren's first- and second-half splits; beyond the results, and into the process.

Based on the FIP formula, Haren's first- and second-half splits are a lot less extreme than they seem by ERA standards (0.86 points). Though Haren tends to walk a few more batters in the second half (4.4 percent uBB versus 3.9 percent), his second-half FIP (3.70) is only 0.40 points above his first-half FIP (3.30). This split is less than half as severe as his ERA split, and relative to his career FIP (3.60), it is not too far apart from what you are paying for.

Digging further, we also find that Haren's second-half batted ball profile indicates that he tends to give up fewer fly balls and more ground balls in the second half compared to the first half. Whereas Haren's career first-half flyball rate is 38.8 percent, his second half rate is 34.4 percent.

In fact, if we calculate Haren's "exFIP" (exFIP is xFIP calculated with HR/OFFB in place of HR/FB, done because a popup can never be a home run) we find the split even tinier, with a 3.35 first-half exFIP and 3.63 second-half exFIP. Haren's expected WHIP splits between his first and second half are even smaller.

So, while it is clear that Haren has been a better pitcher in the first half for his career, his peripherals say that the talent splits between the first and second half for Haren are relatively marginal. Pitchers tend to wear down over the course of a 162-game season, and the cold April weather warms up by July, so I was not be shocked to find that second-half league ERAs tend to be higher than first-half ERAs.

In 2009, for example, the first-half league ERA was 4.09, while the MLB average ERA was 4.57 in the second half. The same was true in 2008 (4.19 versus 4.52) and 2007 (4.36 versus 4.61). 2010 was a different story (4.16 versus 3.98), but the second half of last season marked the beginning of the "new era of the pitcher" everyone loves to write about. In 2010, in fact (and ironically), Haren's first-half ERA (4.60) was higher than his second-half mark (2.87).

So why the major ERA split for Haren?

For one thing, Haren has always been a bit lucky with balls in play during the first half, while the opposite can be said of his second halves. For his career, Haren's first-half BABIP is .274, while his second-half BABIP is .318. His cumulative career BABIP is .291.

In addition to BABIP, Haren has seen more of his fly balls leave the yard in the second half than in the first half. Whereas Haren has a HR/FB rate in the high-nines for his first-half career, that number is close to 11 percent in the second half (10.5 percent MLB average). That is not too surprising, as every 10 degree increase in temperature tends to boost flyball distance by a couple percent.

So what does this mean?

If you currently own Haren, it means do not panic. You own one of baseball's most elite pitchers, and there is no real reason to sell him, especially at a discount, to try to poach a pitcher who is not a "second half dud."

Haren currently owns a 2.54 ERA and 0.98 WHIP. His peripherals says that, as always, he's earned those numbers. Though Haren is no longer pitching in the NL and, as could be expected, striking out about a half-batter fewer per nine innings, he is currently inducing ground balls and popups at career-best or second-best rates.

He owns a 2.51 FIP, and a 2.99 xFIP that is 35 percent better than the rest of the league. Even xWHIP's more-inflated numbers love Haren, claiming his performance to date to be worth a 3.26 eFIP (4.00 MLB mean, compared to a 3.80 MLB mean for xFIP) and a 1.12 WHIP (top 15 among all major league pitchers, including relievers, with at least one game started).

Haren is not someone to trade away unless you get someone just as good in return, and that's not an easy standard to meet, even in the rekindled era of the pitcher.

If you do not currently own Haren, it means you should exploit the myth that Haren can't pitch in the second half. The myth does not mean you can get Haren for Zach Britton, but it does mean you might be able to trade away a "lesser" pitcher like Matt Garza, Josh Beckett, Mat Latos, or Anibal Sanchez as the substantial majority piece (if not a one-for-one deal) in a deal to get him.

You also might be able to swap out ceiling and risk for reliability, moving Josh Johnson as the All-Star break (and his alleged return from the disabled list) approaches. You might also be able to get Haren plus a useable fantasy piece for your team in what should otherwise be a one-for-one deal (e.g., trading Sabathia for Haren plus something).

Either way, you want Dan Haren on your team in the second half.

Are You Sure That's WWJD With Alex Rios?

Again, the "J" stands for Jeffrey

With every passing moment, my confidence in Alex Rios waivers that much more. What do you do with this guy?

On one hand, he is a rare .280+/20/20-type hitter, capable of the kind of balanced production that Mad Money's Jim Cramer would tout if he played fantasy baseball. On the other hand, with the exception of two, arguably three, months of his White Sox career, Alex Rios has been nothing short of atrocious. Some, including myself, lauded Alex Rios' 2010 campaign overall, attributing his second half to the universe's sick way of evening out his first half (though I do not honestly believe in the gambler's fallacy).

Having pegged Rios as a borderline OF1 in 12-team mixed leagues this year, I wonder if it is time to re-evaluate Alex Rios in the context of his 10+ month stint with the Pale Hose. First, let's examine Rios' splits by month, indexing his wOBA value against the league, weighting factors such as park (i.e., wRC+) (click to enlarge):


As you can see, Alex Rios has not been a very productive White Sox. With the exception of April and May of 2010, Rios' wRC+ has been below 100. Even if we credit Rios' June 2010 as "average," his other 7 months (plus what he's done thus far in June of this year) has been objectively poor.

Some, including myself, might be tempted to point to Rios' BABIP. At .276, it is approximately 50 points below Rios' xBABIP as a White Sox. If you adjust Rios' batting line to reflect his xBABIP, you find his expected batting average rises above the .290 threshold, with an OPS in the high .700's.

But isn't it possible that Rios' true BABIP line lie somewhere in between, perhaps closer to .270 than .325? If you take out Rios' first half from 2010 from the equation, the Rios' speed has been merely "league average" since the outset of 2009. Rios' then career-low 5.3 speed score in 2009 looks fast by the standards of his below-average 4.4 mark in 2011. Rios' declining speed is apparent by his three caught stealing and only four successful stolen bases.

Rios is 30 years old, and he's not getting younger. We like to think of hitters' peak and primes occur between their age 27 and 31 seasons, but the truth of the matter is that the talent tends to peak around age 25, followed by a plateau and decline. There really is nothing "magical" about age 27, and just because 40 is the new thirty does not make 30 the new 25. Aging curve research that I have read indicates that players in their thirties tend to lose half a WAR or so per season across their present talent line. That is not to say that Rios is Father Time, but that at age 30, his prime is likely over, the upside is quite limited, and the chances of replicating previous seasons dies with every passing year.

Given his rare 20/20 upside, promising home park, xBABIP, and brand name, it is hard to sell Rios, let alone at a substantial discount. What you get in return will hardly match the price, or contain the upside, you probably paid for with Alex Rios this year. Still, economics tells us the smart investor ignores sunk costs, and it's hardly likely Rios' reaches that level either. Last month I advised not selling yourself too short on Rios, but I am reaching the point where I am regretting that advice. If you offered me 70 cents on the dollar, I might take it.

Give his brand name, it may be possible to convince another owner that you are "selling low" and entice them to buy Alex Rios at a "fair price." If you could get a Colby Rasmus in return, I'd take it. The truth of the matter is, be it because of age or injury, .265/.310/.420 might be all that Rios has got left in the tank at the moment. Rios could touch the 15/15 mark this season, but 12/12 is probably more realistic. Shoot for upside, aim for prospects. I flipped Rios for Anthony Rizzo and Aaron Crow in a league on Tuesday.

So get out there, try and make a trade. Or readjust your expectations. Just don't keep Rios and expect a major bounce back.

Making sense of xWHIP through the power of relativity

The following is my latest article for The Hardball Times.

Before reading this article, I encourage you to read my earlier xWHIP and eFIP; this is an extension of the data presented from it. All statistics are current through May 27.

Earlier this week, I presented an updated form of my xWHIP Calculator, which, with the power of normalization, calculates a pitcher's expected hits and expected innings based on his batted ball profile. In raw form, I presented various data points for both xWHIP and eFIP. While useful, such absolutes can be hard to interpret. What does a 1.16 xWHIP mean in isolation? Particularly with the low variance in WHIP in baseball (the range tends to be largely between 1.10 and 1.50), small differences in WHIP can make a larger difference than you might think.

To address these problems, I have calculated each player's xWHIP Z-Score to give some sense of relativity. Because we are dealing with pitchers, where lower is better, I calculated the data so that the lowest Z-Scores equate the best impact players, while higher Z-Scores indicate the worst players with the biggest impact. I also tabulated a column of weighted Z-Scores scaled to expected innings pitched through May 27. This will give you some sense of which players should, in theory, have had the biggest impact on WHIP through the first two months of the season.

Because this column is weighted based on expected innings to date, which may vary in the future based on past playing time, it should not necessarily be consulted in evaluating a player's prospects (e.g., Zack Greinke has the highest Z-Score at -1.98, but only a -1.22 weighted score due to his limited number of relative starts to begin the season). For future value, you should consult the player's unweighted Z-Score, which should be scaled based on relative expected future innings. For example, if pitcher A is expected to pitch 20 percent more innings than the average full-time starter for the rest of the season, his Z-Score should be adjusted accordingly.

To make the data easier to interpret, particularly because I am using Z-Scores in lieu of an index (this was done because of pitcher clustering; the Z-Score calculations give a better sense of impact and relativity for xWHIP), I color-coordinated the data below.

Orange cells mean that the pitcher is in the upper echelon of the relevant column. For xWHIP, this means the pitcher has an xWHIP below 1.27. For dWHIP (the difference between actual WHIP and xWHIP), this means that the pitcher's xWHIP is at least 0.05 points lower than his actual WHIP to date. For Z-Scores, it means the pitcher has an xWHIP Z-Score of -0.35 or lower. These are likely pitchers to target for acquisition, particularly if one or more of his xWHIP, dWHIP, or Z-Score is colored orange.

Blue cells mean that the pitcher is in the lower tier of the relevant column. For xWHIP, this means the pitcher has an xWHIP of or above 1.34. For dWHIP, this means that the pitcher's xWHIP is at least 0.05 points higher than his actual WHIP to date. For Z-Scores, it means the pitcher has a Z-Score of +0.35 or above. These are likely pitchers to avoid or trade, particularly if one or more of his xWHIP, dWHIP, or Z-Score is colored blue.

Yellow cells are "neutral." These are players who are unlikely to have any significant impact on your team's future WHIP, for better or worse. The xWHIP threshold for neutrality is 1.27 to 1.33. I chose 1.27 as the lower end of the xWHIP threshold, despite the fact that the league average xWHIP is 1.33, because the sample of fantasy players in use is a subset of the starting pitching population. The worst pitchers in the league are unlikely to be on a fantasy roster, and at the same time are likely to post the highest WHIPs. In my preseason E.Y.E.S. post about how to calculate auction values, I tabulated the league average fantasy player's WHIP at 1.265. Because starters tend to have a higher WHIPs than relievers on average (expected mean starter WHIP was 1.30), I am using 1.27 as the lower bound of neutrality.

That all noted, here is a visually organized presentation of the data. The left set of data is organized by xWHIP, while the right set of data is organized by dWHIP (you'll need to click the image to enlarge it):


As always, leave the love/hate in the comments below.

NL Waiver Wire: Weeks 7 and 8

Celebrating my one year anniversary working for The Hardball Times this week. Here are the latest tabs on the NL Edition of the Waiver Wire series: Week 7 and Week 8.

Enjoy

Brandon Morrow (or: How I Learned to Stop Worrying and Love Bud Norris)

The following is my latest article from The Hardball Times.

All stats are current through Monday, May 23.


Eight weeks in to the 2011 baseball season, and Bud Norris is no longer "flying under the radar." Through his first nine starts (55 innings pitched) of the season, Norris is supporting a disgusting 64 strikeouts (27.6 percent strikeout rate, fifth-best amongst all major league starters) to a mere 20 walks (8.62 percent walk rate, on par with perennial Cy Young candidates Tim Lincecum and Josh Johnson) for a strong 3.20 K/BB ratio.

He is also getting more groundball outs (44.7 percent) than flyball outs (38.3 percent), sporting a 1.17 GB/FB ratio and 80.8 percent GB/AO ratio. Norris' peripherals (3.38 FIP, 2.84 xFIP, 3.50 tERA, 3.34 nxFIP*, and 1.21 xWHIP) are quite strong, but his results to date in more traditional metrics have not been too shabby, either (3.91 ERA and 1.31 WHIP, though in "the year of the pitcher," such stats rank 93rd and 89th, respectively, out of the 169 starting pitchers with 10-plus innings pitched in 2011).

*nxFIP stands for normalized xFIP. It is calculated similarly to xFIP, only a pitcher's line drive rate is normalized to 19 percent, with his residual balls in play being distributed based on the pitcher's groundball to flyball and outfield flyball to infield flyball ratios. Once the normalized outfield flyball total is calculated, I multiply this figure by one-half the pitcher's home park park factor for home runs per outfield flyball rate times 11.5 percent.

Noting this dominance to date this year, and highlighting that Norris was hardly an "unknown" entering the season after last year's well-publicized 158 strikeouts (9.25 K/9, eighth-highest in the major leagues among starters with 150-plus innings pitched) and 77 walks (18th-highest walk total in the majors last season amongst all pitchers) over 153.2 innings, why is Norris not owned in even half of Yahoo leagues (46 percent ownership)?

More curiously, why is Norris owned in just over half as many leagues as his fragile American League clone, Brandon Morrow (82 percent Yahoo ownership). It's not like Morrow (5.06 ERA, 1.44 WHIP) is exactly lighting the world on fire.

First, let's look at how the two pitchers are similar. Here are each's peripherals (and the major league average for each category) on the season:


PlayerK%BB%SwStr%F-Strike%Contact%GB%FB VelocitySlider%FIPxFIPxWHIPwOBA-against
Bud Norris27.6%8.6%12.0%62.5%73.0%44.7%92.6 MPH37.6%3.382.841.21.313
Brandon Morrow30.3%10.6%12.4%64.8%72.5%32.9%93.4 MPH24.7%2.122.971.28.288
MLB Average17.9%7.8%8.4%58.9%80.9%42.2%91.7 MPH15.1%3.803.701.34.312


And for their careers:


PlayerK%BB%SwStr%F-Strike%Contact%GB%FB VelocitySlider%ERAFIPxFIPxWHIP
Bud Norris23.7%10.5%11.2%57.0%74.8%42.0%93.534.7%4.634.133.801.36
Brandon Morrow (as SP)26.1%11.6%11.1%54.4%74.9%37.9%93.715.4%4.543.643.821.42


Both pitchers stand out as big strikeout pitchers for their career (posting top-10 SwStr% rates of any starting pitcher between 2007 and 2011) with large walk rates to boot (a combined 339 batters walked over just 640.1 combined innings pitched (4.76 BB/9, 12.1 BB%)).

Each is right-handed, throws a good number of breaking balls (particularly the slider), and each throws hard. Morrow has proven to be a bit more of a strikeout pitcher than Norris for his career, but Norris makes up for that with more groundballs.

There is a difference in their career and 2011 FIPs, but some of that might be HR/FB% luck, as each pitcher has near-identical xFIPs for their career and on the year.

Morrow and Norris have comparable fastball velocities as starters, and hitters similarly struggle to make contact against their pitches. Norris tends to throw more (and a lot of) breaking balls (particularly sliders) than Morrow, which is clearly a red flag for his long-term health, but it is not exactly as though Morrow is a model of health himself, having been on the DL at least once each of his pro seasons (not to mention the fact that Morrow also has diabetes). Both pitchers are also about the same age (26-ish), with Morrow being Norris' senior by less than a year.

Both tend to fair worse against lefties, but only Morrow's career split (4.57 xFIP versus LHB, compared to a 3.48 xFIP versus RHB) stands out as significant (Norris' career LHB/RHB xFIP split is 4.00 to 3.63), but Morrow's struggles against lefties have lessened in recent years (3.87 xFIP versus LHB in 2010, 3.12 in 2011).

Hence, for all intents and purposes, we have two identical pitchers. Yet one is owned in less than half of fantasy leagues out there, while the other is almost universally owned.

That is mind-boggling, especially when you consider that not only does Norris play in the NL, meaning that about 10 percent of his opposing batters tends to be pitchers, but he plays in the weakest division in baseball, the NL Central, which, although he cannot face his own team, still nonetheless features the below .500 and offensively-inept teams that are the Pirates and Cubs (sad face) in a disproportionate number of series. Compared this to Brandon Morrow, who faces three of baseball's most fearsome offenses in the Boston Red Sox, Tampa Bay Rays, and New York Yankees in a disproportional number of games.

Yet Morrow, modern strikeout champion of the almost no-no crown, has brand power, while Norris toils away on the shelf like a generic-label product that is also manufactured by the brand-name producer. It makes you wonder why Dallas Braden did not get any kind of love heading into the season (yeah, yeah the whole foot nerves thing, we get it).

Noting this all, what does it mean?

It means that you can get a hefty return for Morrow, trade less than that away for Norris, and come away with a relative profit that improves your team overall while maintaining the same level of production in mixed leagues.

Brand name is a large component of arbitrage in fantasy baseball. Players with less hype and less of a track record of success, including breakout players, tend to have lower trade values than established or hyped players. This is why it is so hard to "buy low" and "sell high" most of the time.

On the flip side of that coin, however, is the "sell low" and "buy high" strategy. It may seem anachronistic, but selling low or at market on hyped guys and buying low on players that owners tend to be cautious with can net you a large profit because such deals tends to maximize the value you receive while relatively minimizing the cost you have to pay.

Take, for instance, the cost of acquiring Jose Bautista last year. I went on record early and often in last year's AL Waiver Wire and other fantasy columns noting how much I believed in Bautista's pull power in the Rogers Center. I never thought he would hit 50 homers from the beginning, but I bet a friend in May, 2010 that he would hit 30 and tried to up the ante, double or nothing, to 40 around the All-Star Break.

Most Bautista owners wearily plucked him off the wire last season and were cautious to play him. On one hand, you gotta ride the hot streak, but on the other, "This is Jose frickin' Bautista we're talking about."

You obviously could not have acquired him for free, as a "toss in" or for a fungible bench player, but compared to the value produced by Bautista each month last season, you could have acquired him for pennies on the dollar. In one of my primary leagues last season, I traded away Jay Bruce plus Dan Uggla in May to get Bautista and Martin Prado.

The unknown is scary, but fear has a deprecating effect on value that you can intelligently exploit to your advantage. Think of it as buying junk bonds. People are afraid of owning them as an investment vehicle, but they're less risky than common stock.

That's why I like to invest heavily, albeit at a discount, in players like Michael Pineda and Brandon Beachy either on draft day or early in the season (though sometimes, as in the case of Kyle Drabek (who I, thankfully, was able to universally flip for Ryan Dempster after his 0.1 inning disaster at Chase Field), you just lose).

The end of May brings the beginning of real trading season in fantasy baseball. For the first six to eight weeks of the season, owners tend to be patient, opting for waiver wire moves, "waiting it out" and minor trades over major/big-name trades to fill team holes. It is not really until you reach the 50-game mark that a team's "needs" becomes readily apparent. Owners are cautious to avoid conflating "need" and poor construction with bad luck. Accordingly, this is what I recommend.

First, trade Morrow. With a 5.06 ERA and 1.44 WHIP on the season, this may be a harder task than it was in the preseason, but Morrow's AL-leading 12.09 K/9 (second-best in the major leagues) and enticing peripherals will lure plenty of owners to bite if you going trade fishing. Morrow, thanks to Josh Shepardson and the boys at ESPN, was a hype machine this offseason, and I guarantee you that you overpaid for what Morrow is capable of doing on his own merit.

I almost guarantee you as well that, despite what you paid for Morrow (unless you ridiculously overpaid for him), there is an owner out there willing to relieve you of your investment at cost (or better). Enough people understand FIP to think they would be buying low on an ace.

But why trade Morrow? His FIP, xFIP, and tERA are all under 3.00 this year, and he is a strikeout god. The answer is in his control. Much of Morrow's preseason hype came as a result of his second-half recall on free passes issued. Over his final ten starts of the season (56.1 innings pitched) before getting shut down, Morrow only walked 22 batters, good for a 3.51 BB/9.

That was a marked improvement over his career walks-per-nine rate (north of 5.00), but it came at the expense of fewer first-pitch strikes than either his career or first-half averages. First pitch strikes tend to be half the battle in walk rates for pitchers, and a 56-inning sample is hardly a reliable enough sample size to discount umpire luck or some other element to blame other than truly improved control. Furthermore, Morrow's current walk rate (4.22 BB/9) represents a large step back from last year's second half "improvement."

At the same time, Morrow's peripherals, while impressive, may not truly be as notable as they currently look. If we ignore Morrow's season debut (5.1 innings pitched, 10:2 K/BB ratio), his strikeout rate on the season falls from north of 30 percent to 27.0 percent on the dot, or a batter per nine innings. Likewise, his walks-per-nine rate would increase to 4.38.

A 27.0 percent strikeout rate (11.1 K/9) is hardly something to sneeze at, but if we also regress Morrow's current 2.9 percent HR/FB rate to his career rate of 8.1 percent (I do this cautiously, rather than regress his HR/FB rate towards the major league average of 10.5 percent*, as there is an as-yet-unproven theory that power pitchers can outperform league-average HR/FB rates), his FIP rises from 2.20 to the 3.50.

Of course, that is still solid, but if Morrow's control regresses any further, or if Morrow's groundball rate continues to float around what it was while he was in Seattle, his expected FIP could easily approach the 4.00 mark.

*League average HR/FB percent tends to be around 10.5, while HR/OFFB percent tends to be closer to 11.5.

More worrisome are Morrow's numbers if we plug in his 2011 stats, omitting his first start, into the lastest version of my xWHIP calculator (NOTE: I do not have runs-created values for 2011 offhand, so the tERA cell is set to 0.00):

image

Do not get me wrong; Morrow is clearly valuable and a pitcher worth owning that will do wonders for your strikeout rate. At the same time, however, he is a commodity whose current perception overshadows his actual and potential value. When a player has this kind of potential trade value above his expected value, he is a prime trade chip.

At the same time, I would recommend acquiring Norris for all the reasons to love Morrow, except he will cost you a fraction of what you'd have to trade away to get Morrow. Norris, like Morrow, has his control and injury-risk issues, but he racks up elite strikeouts and could conceivably pile up more total innings over the rest of the 2011 season.

Norris' peripherals show that he is just as likely to have taken that "big step forward" as Morrow, but the season is still young and his slowly-increasing army of owners might cautiously believe that they are just riding a hot streak.

Do not let anyone sucker you into believing that Norris is thriving off weak teams and favorable matchups. While it is true that his two worst starts came against two strong offenses in the early-hot-hitting Philly (April 3) and St. Louis last week (May 18), Norris still shut down those same Cardinals earlier in the season (6.0 innings pitched, zero earned runs, 6:2 K/BB ratio on April 26), and he obliterated Milwaukee at the beginning of the month (7.2 innings pitched, no earned runs, 11:3 K/BB ratio on May 1).

As the above indicates, Norris is not just a poor man's Morrow; he is the smart investor's Morrow clone. Both Morrow and Norris are elite strikeout sources who probably will not obliterate your WHIP or ERA (even in a season where some 40 starting pitchers (minimum 10 innings pitched) have sub-3.00 ERAs) on the merit of their relatively undifferentiated pitching talents. Neither pitcher is likely to win many games, Morrow because he tends to rack up high pitch counts and depart games early, and Norris because he plays for the offensively inept Astros).

One, however, probably has a trade value above market, while the other can be had at a discount. Earlier in May, I was able to trade away Brandon McCarthy and Luke Gregerson (whom I replaced with Sean Marshall) for Norris. If you offered that for Morrow, you'd probably be laughed out of your league. Yet, no one had anything to say about my under-the-radar move.

Would you trade away Morrow, or am I just crazy? If you would trade him, what kind of value would you need/do you think you could get in return? Sound off in the comments below.