Coming up soon Game Of Inches will post their running back rankings but for now I would like to discuss my stance on Kansas City Chiefs running back Jamaal Charles. (EDITOR'S NOTE: You can now view GOI's RB rankings here). I do not trust Charles for two reasons. The first is that I loaned him 100 bucks a few years back because he said he needed it the money to help his ailing grandmother and I still have not seen that money to this day. The second reason is that I do not trust his Yards Per Carry (YPC) going forward.
Jamaal Charles currently holds an incredible career 6.0 YPC. In his 2009 breakout season he had a YPC of 5.9 (spending time as both a starter and a back up) and had an incredible 6.4 YPC as a starter in 2010.
At the end of the 2009 season fantasy owners were clamoring at the chance to draft Charles. Then the Chiefs signed Thomas Jones and Charles' value deflated to being drafted out of the first round and to not being a top ten running back. But the fantasy owners who continued their faith in Charles were heavily rewarded when Jamaal Charles ended up the third best fantasy running back in 2010.
However, I am still down on Charles. He has now proven to me that he is just a stud on the field and a top 10 fantasy running back- even with Thomas Jones there. Despite the double headed threat of Charles and Thomas, Jamaal Charles still got as many carries as guys like Run DMC (Darren McFadden) and Matt Forte. Sure, as a fantasy owner I would like to see him get more than the 11-15 he averaged per game in 2010, but with Charles' high YPC and explosive talent, fantasy owners did not mind as much last year.
But now what scares me going forward is that I believe Jamaal Chalres' YPC will decrease.
I was joking around with fellow Game Of Inches author The 'Bright' One about my fear when he said "What, his YPC will drop down to 5.3?" Well... yes. Certainly if I were a Kansas City Chiefs fan I would take a 5.0+ YPC in a heartbeat and anyone who has seen Charles play (including that pitiful playoff game the Chiefs played where Charles has an amazing 9.11 YPC- but only off of 9 rushing attempts) knows just what a great physical runner Charles is. There is no doubt in my mind that Charles will have a YPC over 5.0 next year. However, this creates a huge problem for fantasy owners because Charles needs an extremely high YPC to make up for his low amount of touches.
In 2009 the great Chris Johnson *only* had a YPC of 5.6 which decreased to 4.3 in 2010 which in turn hurt Johnson's fantasy value. While CJ ended up as a top five fantasy running back, he still was a disappointment last year. (Just ask anyone who drafted Johnson #1 overall and they'll agree with me.) Defenders would respond to this argument by saying that it was easier to defend Johnson by just stacking the box considering the QB carousel that happened in Tennessee with guys like Rusty Nail (excuse me, Rusty Smith) at the helm at QB.
However, I think that same argument could be made for Matt Cassel next season. Matt Cassel had a great 2010 campaign and earned a deserving berth to the Pro Bowl. However, what Cassel had last year that I do not believe he will have in 2011 is the ability to play against inferior competition. The Kansas City Chiefs had an extremely weak schedule (in terms of passing defense) once they played the horrific secondary of the Houston Texans in Week Six and got to play the great and almighty secondaries of Denver (twice), Jacksonville, Seattle, and San Francisco- all of whom were in the bottom ten in terms of passing defense. Just ask any Dwayne Bowe owner last year- his amazing season did not start until his 108 yards / 2 TD game against Houston (I know because a person in my league benched him for that start because Bowe looked and was atrocious from weeks 1-5). My point is, with tougher passing defenses to play in 2011, Charles will not have the luxury of Matt Cassel and Dwayne Bowe taking defenders away from him like they did last year and I can see that affecting his YPC in 2011 like it did Chris Johnson in 2010.
"So What?" you may be asking yourselves. "All you have told me is that Charles will have tougher competition, but I don't care, Charles is a stud and that's all that matters." True, Charles is a stud, but let me show you why a lower YPC matters.
Last year, Charles ran for 1467 yards. This was good enough to be the second best rusher in the league only to Arian Foster. Now let's say his YPC does drop to 5.3. I do not believe his carries will increase because Thomas Jones is still there. Plus, Kansas City far and away led the league in rushing attempts with 556 and you rarely (if ever) see a team repeat from year to year being the leader in rushing attempts. If anything I would assume his carries would go down more than go up just because the amount of carries Kansas City has to offer will decrease next season. Charles was amazing at the end of 2009 as well as last year and he still rarely got more than 15 carries a game.
Let us now assume Charles does get the same amount of carries as he did last year- 230. You take that amount of carries and add it to *only* a 5.3 YPC and you get 1,219 rushing yards. Still extremely good, but that would now drop him to the tenth best runner last year behind Ray Rice.
You add to this *low* yard total the fact that Charles does not score touchdowns and you have a recipe for a bust if you draft him high. Despite Charles' explosiveness Charles only had five rushing touchdowns and only three of them came within the first thirteen weeks of the season (before most fantasy playoffs began). Charles only had eight touchdowns total (5 rushing, 3 receiving) which was behind top studs like AD, CJ, BJGE, Arian Foster, and Michael Turner's rushing touchdown totals.
Now touchdowns are a finicky thing. There are extremely volatile and unpredictable from year to year. It's extremely possible that Charles' gets 13 total touchdowns next year which will more than make up for his decrease in rushing yards. However, guys who tend to score a lot of touchdowns tend to do so year to year and guys who do not tend to not. While it is most certainly within the realm of possibility that Jamaal Charles gets more touchdowns next year, it seems unlikely that he would with a decrease in yards per carry and the fact that Thomas Jones is still there to vulture touchdowns away. In fact, because of Thomas Jones, Charles' TD/carry dropped from 2009 to 2010 even though he gained the full time starter job for all 16 games in 2010.
Last year, if you assume that Charles got the same number of carries, the same number of touchdowns, the same number of fumbles, and the same number of receiving yards (in the same weeks he got them in) but you drop his YPC from 6.4 to 5.3 he would have scored 205 fantasy points- which would have dropped him down from 3rd to t-8th. Again, still really good, but there's one more assumption that we didn't address that now needs to be factored into the equation: Charles' receiving totals.
Last year Charles had 45 catches for 468 yards. Those receiving totals added an extra 40 points to his fantasy total (despite the fact that overall 468 yards = 46 fantasy points, if you look back at Charles' game log you will notice, as with all fantasy players, that he did not get even receiving yard totals week to week. So say Charles got 17 receiving yards in Week One and 3 receiving yards in Week Two that actually only amounts to 1 fantasy point for the two weeks even though if you combine them it would appear as if you would get 2 fantasy points). And as mentioned earlier with what I believe will be an inferior passing attack for the Chiefs from 2010 to 2011, I expect Charles' passing numbers to decrease a bit as well.
Certainly a 5.3 YPC is an arbitrary number. That would be a 1.1 YPC drop for Charles. Ray Rice dropped 1.3 YPC from 2009 to 2010. The same with Chris Johnson. Rashard Mendenhall dropped 0.7. Matt Forte gained 0.9 YPC. Even though I just picked 5.3 out of thin air, my point remains that I think Charles YPC will drop and I think it will drop significantly to the point that his fantasy value will drop from his amazing 2010 campaign.
As mentioned earlier in the article, if Jamaal Charles did have a 5.3 YPC last year that would put him tied as the eighth best fantasy running back. This is still really good. Despite what may appear to be me bashing him in this article I merely just meant to point out that I think you should temper your expectations on him coming into the 2011 season (if there is a 2011 season). On a recent Article of the Day on FFSpin, Fantasy Sharks suggested that you draft Charles #4 overall. I have to respectfully disagree with my colleagues. In my rankings, soon to come out, I ranked Charles as my seventh best running back. This is still a dive from the #3 spot he ended at last year but also still a #1 RB in all leagues deeper than the ones the guys play in on the FX show The League.
I think Charles will still be good in 2011 and I think Charles will still be a productive fantasy running back in 2011 but what I do think is Charles will not be as productive (on a per game basis) in 2011 as he was in 2010. Now if he could only pay back the money he owes me I would greatly appreciate it.
2011 Fantasy Football Rankings- Tight Ends
Sure, there might be a lock out for the NFL. Sure, we might not have a football season. Sure, I might be relegated to playing fantasy basketball and/or fantasy college football this fall (or even worse… fantasy hockey). But that's not stopping us here at GOI from fantasizing about fantasy football. Today, in my mother's basement (because we're bloggers so of course we blog from my mom's basement) Cubsfan, The 'Bright' One and myself got together for our own fantasy rankings summit. Individually we came up with our own lists for each of the four major positions (QB, RB, WR, and TE) and then I have compiled a composite list for the site.
This is currently a first draft. The biggest factor that will change all of our rankings is free agency. For the most part we assumed free agents will stay with their current teams. There are some players that we assumed will be leaving their current team, but for the most part we ranked players based on where they played in 2010. Preseason (if there is one) and injuries will also most certainly affect out rankings, but for right now. Here are our lists.
We will be doing a four part series. Each day for the next consecutive days GOI will post our lists for a particular position. This post is obviously dedicated to Tight Ends.
The 'Bright' One did not create lists coming into the summit and reluctantly created partial lists for quarterbacks, wide outs, and running backs during the discussion, but he did not create a tight ends list so for right now his rankings will not be included.
COMPISITE RANKINGS (Player / Average Rank)
1) Antonio Gates (SD) | 1.00 |
2) Dallas Clark (IND) | 2.50 |
2) Jermichael Finley (GB) | 2.50 |
4) Jason Witten (DAL) | 4.50 |
5) Vernon Davis (SF) | 5.00 |
6) Owen Daniels (HOU) | 8.50 |
6) Zach Miller (OAK) | 8.50 |
6) Kellen Winslow (TAM) | 8.50 |
9) Jimmy Graham (NO) | 10.00 |
10) Chris Cooley (WAS) | 12.00 |
11) Rob Gronkowski (NE) | 12.50 |
11) Tony Moeaki (KC) | 12.50 |
13) Tony Gonzalez (ATL) | 13.00 |
14) Mercedes Lewis (JAX) | 14.50 |
15) Brandon Pettigrew (DET) | 15.00 |
16) Jermaine Gresham (CIN) | 15.50 |
16) Aaron Hernandez (NE) | 15.50 |
18) Todd Heap (BAL) | 16.50 |
19) Dustin Keller (NYJ) | 21.00 |
20) Brent Celek (PHI) | 21.50 |
21) Visanthe Shiancoe (MIN) | 22.00 |
24) Greg Olson (CHI) | 22.50 |
23) Benjamin Watson (CLE) | 23.50 |
The first column is Sexy Rexy's list and the second column is Cubsfan's list
1) Antonio Gates (SD) | 1) Antonio Gates (SD) |
2) Jermichael Finley (GB) | 2) Dallas Clark (IND) |
3) Dallas Clark (IND) | 3) Jermichael Finley (GB) |
4) Vernon Davis (SF) | 4) Jason Witten (DAL) |
5) Jason Witten (DAL) | 5) Owen Daniels (HOU) |
6) Owen Daniels (HOU) | 6) Vernon Davis (SF) |
7) Rob Gronkowski (NE) | 7) Jimmy Graham (NO) |
8) Kellen Winslow (TAM) | 8) Zach Miller (OAK) |
9) Zach Miller (OAK) | 9) Kellen Winslow (TAM) |
10) Tony Gonzalez (ATL) | 10) Aaron Hernandez (NE) |
11) Tony Moeaki (KC) | 11) Jermaine Gresham (CIN) |
12) Chris Cooley (WAS) | 12) Chris Cooley (WAS) |
13) Jimmy Graham (NO) | 13) Brandon Pettigrew (DET) |
14) Mercedes Lewis (JAX) | 14) Tony Moeaki (KC) |
15) Anthony Fasano (MIA) | 15) Mercedes Lewis (JAX) |
16) Todd Heap (BAL) | 16) Tony Gonzalez (ATL) |
17) Brandon Pettigrew (DET) | 17) Todd Heap (BAL) |
18) Dustin Keller (NYJ) | 18) Rob Gronkowski (NE) |
19) Michael Hoomanawanui (STL) | 19) Brent Celek (PHI) |
20) Jermaine Gresham (CIN) | 20) Jared Cook (TEN) |
21) Aaron Hernandez (NE) | 21) Visanthe Shaincoe (MIN) |
22) Greg Olson (CHI) | 22) Benjamin Watson (CLE) |
23) Visanthe Shancoe (MIN) | 23) Greg Olson |
24) Brent Celek (PHI) | 24) Dustin Keller (NYJ) |
25) Benjamin Watson (PHI) | 25) Heath Hiller (PIT) |
Next Post: Wide Receivers


New Podcasts Up!: The Boys Are Back In Town
New podcast up with Sexy Rexy and The 'Bright' One.
You can listen to the new podcast here
__________________________________________
NOTE: If you want to download these or any of GOI's podcast's via iTunes just follow these instructions. Go to the iTunes store and type "Game Of Inches" into it. If you don't see the GOI logo (the one with the fuzzy black background and bright "GOI" lettering on it) then go to the left where it says "Filter By Media Type" and click on "Podcasts". You should see two logos. The second one has the newer podcasts.
You can listen to the new podcast here
__________________________________________
NOTE: If you want to download these or any of GOI's podcast's via iTunes just follow these instructions. Go to the iTunes store and type "Game Of Inches" into it. If you don't see the GOI logo (the one with the fuzzy black background and bright "GOI" lettering on it) then go to the left where it says "Filter By Media Type" and click on "Podcasts". You should see two logos. The second one has the newer podcasts.
Common Misconceptions
There are many things in sports that we belive are true. But we here at GOI do not believe in what the "norm" is as told to us by others. Our belief has always been to debunk the general belief whenever possible. We're a regular Ken Kesey! There are many things that we as a society have just come to believe is true regarding certain sports events, so I'm going to spend some time debunking those myths.
Myth: In 1980 at the Winter Olympics, the winner of the hockey match between the USA and the Soviet Union was the winner of the gold medal and because the USA defeated USSR, the US won the gold.
Fact: The USA team still had to defeat Finland in order to win the gold.
Back Story: The way the hockey tournament worked back in 1980 in the final round was a round robin tournament (kind of like how the first round of World Cup soccer works now). There were four teams that made it to the final round in 1980 and they were: USA, Soviet Union, Finland, and Sweden. The first match up of this final tournament was the USA vs. Soviet Union where the United States did win 4-3 (now known as The Miracle on Ice), but on that very same day Finland and Sweden tied 3-3. A few days later the USA went on to defeat Finland 4-2 where the future Russia destroyed Sweden 9-2.
Because the United States was the only team in the tournament to win two games, they were the winners of the gold medal. If the U.S. had defeated the Soviet Union but lost to Finland then they would not have won the gold.
The USA defeating the Soviet Union was still an amazing, ungodly feat and they did win the tournament which was even more amazing, and the the Soviet Union did end up getting silver in the tournament. However, that great win over the Soviet Union did not clinch the gold for us Yankees.
Myth: The ball that went through Bill Buckner's legs in the 1986 World Series between the Red Sox / Mets lost the Red Sox the whole sha-bang
Fact: That game was only Game 6. The Red Sox still could have won it all after that play. Plus, Buckner was not the only one to blame.
Back Story: Everyone knows the infamous play. Even if you can't remember the name of the Red Sox first baseman like that guy in the old KGB commercial, you still know the play I'm talking about. Mets left fielder Mookie Wilson hits a soft ground ball to first base, Buckner fails to ground the ball, then the guy on third scores and wins the game. But not only was Buckner not at fault for losing that game but the Red Sox still could have won that series.
Let me set up what actually happened during that inning. It was Game Six. The Red Sox were up 3-2 in the series. It was the bottom of the 10th inning, the Red Sox had scored 2 runs that inning to go up 5-3. In the bottom of the 10th, Gary Carter scores making the score 5-4. Then, pitcher Calvin Schiraldi gets replaced in favor of Bob Stanley. Stanley is now pitching to Mookie Wilson and then goes ahead and throws a wild pitch so the runner from 3rd scores the tying run. The game is now 5-5.
Then the infamous Bill Buckner play happens.
But think about this for a second. Let's say Buckner makes that play. The game is now still tied and on to extra innings we go. The Red Sox still could have lost that game. But Buckner didn't make that play and the Red Sox STILL have a chance to win it all. While Buckner had an awful 1986 playoffs, his team still could have won Game 7.
One last thought: throughout the series Buckner, who was playing on two bad ankles, was normally pulled in the playoffs for a defensive replacement by his manager, John McNamara, late in games. McNamara deserves some of the blame along with Stanley for losing Game 6. Sure, Buckner should not have let that ball roll through his feet no matter what because he was a professional, but he does not deserve 100% of the blame that we all think he deserves.
Myth: Joe Namath was a good quarterback
Fact: Joe Namath was NOT a good quarterback
Back Story: Joe Namath deserves a lot of credit for making the NFL what it is today. During the early origins of the NFL and AFL (the early makings of the NFC and AFC of what we know today) the AFL was just an expansion league that was deemed inferior to the juggernaut of the NFC (kind of how we view the wimpy NL today! Just kidding.). During Superbowls I and II the NFL dominant Green Bay Packers won over the can't-cut-it-with-the-big-boys AFL.
Then came Superbowl III.
The handsome, counterculture sex symbol (I mean, come on, he did look super hot wearing pantyhose in that commercial) that we know today as Joe Namath led the AFL champions against the Baltimore Colts (who were just as dominant back then as the Indianapolis Colts are today) in Superbowl III. Namath promised that the AFL and the Jets would win and like Babe Ruth pointing to the exact spot he was going to hit his home run (actually, I'm sure that is sort of a myth as well, but I am not going to get into that today) the Jets did win the game against the big, bad Baltimore Colts which helped solidify the merging of the NFL and the AFL.
However, it is that promise and winning that game that make people think Joe Namath was a hall of fame quarterback and they fail to recognize what a truly awful QB Namath was throughout his entire career.
I wrote a post a while back about how overrated Joe Namath is, but for those of you who have already read enough, let me break down some facts for you. Namath has more interceptions (220) than touchdowns (173) in his career (and it is really not all that close) and has a career passer rating of 65.5.
I believe everyone owes a debt of gratitude to Namath for helping merge the AFL and the NFL, but let's put his entire career into perspective. A few years ago, ESPN did a Mount Rushmore of great athletes associated with a particular American state and Namath was on New York's. That's now getting a bit ridiculous (Although before Tim Tebow was even drafted he was on Florida's Mt. Rushmore as voted on by the fans and that was even more ridiculous). I can name at least four Yankees alone that deserve to be on the Mount Rushmore more than Namath does (Ruth, Jeter, Mantle, Gehrig, Mo Rivera, Berra, Maris, Reggie. There, I just named two Mount Rushmore's full of players that deserve more praise than Namath). Point is, people put Joe Namath on a pedastool like pussy in The 40 Year Old Virgin and while I think he deserves our admiration for helping to merge the AFL and NFL, we all need to be reminded he really was not that good.
Myth: Jerry Rice put up most of his stats with Joe Montana
Fact: Rice played more with Steve Young than Joe Montana.
Back Story: Jerry Rice is the greatest wide receiver ever. What Randy Moss did in his career year in 16 games Rice did in 14. If you look at Rice's numbers and then look at everyone else's numbers no one compares to him. But what people think is that him and Joe Montana was the original Peyton Manning / Marvin Harrison. That is just not true. I think people assume that because Montana won four championships and because he and Rice were some of (in Rice's case he was) the greatest at their position that they were great together. However, Rice actually played more games with Steve Young than Joe Montana.
Rice played from 1985 to 2004 and played for San Francisco until 2000. Joe Montana played for San Fran from 1979 to 1990 (technically until 1992 but he was injured and did not play in '91 and '92). Montana played a good six years before Rice ever got there and left a good decade before Rice left. In fact, Rice and Montana only played for five years together.
Steve Young on the other hand played for the gold diggers from 1987-1999 while really playing hall of fame ball (and even playing at all) from 1991-1998. Young played with Rice for eight years- two more than Montana.
Then we have Jeff Garcia. Garcia replaced Young and played for the 49ers from 1999-2003 where he got to play with Rice for two seasons.
Rice has 197 touchdowns. 54 of them were thrown by Montana. 84 of them were thrown by Young.
Sure, Jerry Rice has three Superbowl championships and two of them were with Montana, but the plurality of his career (oooh! My Poly Sci degree has paid off because I get to use the word "plurality") was with Steve Young, not Joe Montana.
_____________________
Here are my four big misconceptions. Please read my Matrix Revolution below for Part II.
Myth: In 1980 at the Winter Olympics, the winner of the hockey match between the USA and the Soviet Union was the winner of the gold medal and because the USA defeated USSR, the US won the gold.
Fact: The USA team still had to defeat Finland in order to win the gold.
Back Story: The way the hockey tournament worked back in 1980 in the final round was a round robin tournament (kind of like how the first round of World Cup soccer works now). There were four teams that made it to the final round in 1980 and they were: USA, Soviet Union, Finland, and Sweden. The first match up of this final tournament was the USA vs. Soviet Union where the United States did win 4-3 (now known as The Miracle on Ice), but on that very same day Finland and Sweden tied 3-3. A few days later the USA went on to defeat Finland 4-2 where the future Russia destroyed Sweden 9-2.
Because the United States was the only team in the tournament to win two games, they were the winners of the gold medal. If the U.S. had defeated the Soviet Union but lost to Finland then they would not have won the gold.
The USA defeating the Soviet Union was still an amazing, ungodly feat and they did win the tournament which was even more amazing, and the the Soviet Union did end up getting silver in the tournament. However, that great win over the Soviet Union did not clinch the gold for us Yankees.
Myth: The ball that went through Bill Buckner's legs in the 1986 World Series between the Red Sox / Mets lost the Red Sox the whole sha-bang
Fact: That game was only Game 6. The Red Sox still could have won it all after that play. Plus, Buckner was not the only one to blame.
Back Story: Everyone knows the infamous play. Even if you can't remember the name of the Red Sox first baseman like that guy in the old KGB commercial, you still know the play I'm talking about. Mets left fielder Mookie Wilson hits a soft ground ball to first base, Buckner fails to ground the ball, then the guy on third scores and wins the game. But not only was Buckner not at fault for losing that game but the Red Sox still could have won that series.
Let me set up what actually happened during that inning. It was Game Six. The Red Sox were up 3-2 in the series. It was the bottom of the 10th inning, the Red Sox had scored 2 runs that inning to go up 5-3. In the bottom of the 10th, Gary Carter scores making the score 5-4. Then, pitcher Calvin Schiraldi gets replaced in favor of Bob Stanley. Stanley is now pitching to Mookie Wilson and then goes ahead and throws a wild pitch so the runner from 3rd scores the tying run. The game is now 5-5.
Then the infamous Bill Buckner play happens.
But think about this for a second. Let's say Buckner makes that play. The game is now still tied and on to extra innings we go. The Red Sox still could have lost that game. But Buckner didn't make that play and the Red Sox STILL have a chance to win it all. While Buckner had an awful 1986 playoffs, his team still could have won Game 7.
One last thought: throughout the series Buckner, who was playing on two bad ankles, was normally pulled in the playoffs for a defensive replacement by his manager, John McNamara, late in games. McNamara deserves some of the blame along with Stanley for losing Game 6. Sure, Buckner should not have let that ball roll through his feet no matter what because he was a professional, but he does not deserve 100% of the blame that we all think he deserves.
Myth: Joe Namath was a good quarterback
Fact: Joe Namath was NOT a good quarterback
Back Story: Joe Namath deserves a lot of credit for making the NFL what it is today. During the early origins of the NFL and AFL (the early makings of the NFC and AFC of what we know today) the AFL was just an expansion league that was deemed inferior to the juggernaut of the NFC (kind of how we view the wimpy NL today! Just kidding.). During Superbowls I and II the NFL dominant Green Bay Packers won over the can't-cut-it-with-the-big-boys AFL.
Then came Superbowl III.
The handsome, counterculture sex symbol (I mean, come on, he did look super hot wearing pantyhose in that commercial) that we know today as Joe Namath led the AFL champions against the Baltimore Colts (who were just as dominant back then as the Indianapolis Colts are today) in Superbowl III. Namath promised that the AFL and the Jets would win and like Babe Ruth pointing to the exact spot he was going to hit his home run (actually, I'm sure that is sort of a myth as well, but I am not going to get into that today) the Jets did win the game against the big, bad Baltimore Colts which helped solidify the merging of the NFL and the AFL.
However, it is that promise and winning that game that make people think Joe Namath was a hall of fame quarterback and they fail to recognize what a truly awful QB Namath was throughout his entire career.
I wrote a post a while back about how overrated Joe Namath is, but for those of you who have already read enough, let me break down some facts for you. Namath has more interceptions (220) than touchdowns (173) in his career (and it is really not all that close) and has a career passer rating of 65.5.
I believe everyone owes a debt of gratitude to Namath for helping merge the AFL and the NFL, but let's put his entire career into perspective. A few years ago, ESPN did a Mount Rushmore of great athletes associated with a particular American state and Namath was on New York's. That's now getting a bit ridiculous (Although before Tim Tebow was even drafted he was on Florida's Mt. Rushmore as voted on by the fans and that was even more ridiculous). I can name at least four Yankees alone that deserve to be on the Mount Rushmore more than Namath does (Ruth, Jeter, Mantle, Gehrig, Mo Rivera, Berra, Maris, Reggie. There, I just named two Mount Rushmore's full of players that deserve more praise than Namath). Point is, people put Joe Namath on a pedastool like pussy in The 40 Year Old Virgin and while I think he deserves our admiration for helping to merge the AFL and NFL, we all need to be reminded he really was not that good.
Myth: Jerry Rice put up most of his stats with Joe Montana
Fact: Rice played more with Steve Young than Joe Montana.
Back Story: Jerry Rice is the greatest wide receiver ever. What Randy Moss did in his career year in 16 games Rice did in 14. If you look at Rice's numbers and then look at everyone else's numbers no one compares to him. But what people think is that him and Joe Montana was the original Peyton Manning / Marvin Harrison. That is just not true. I think people assume that because Montana won four championships and because he and Rice were some of (in Rice's case he was) the greatest at their position that they were great together. However, Rice actually played more games with Steve Young than Joe Montana.
Rice played from 1985 to 2004 and played for San Francisco until 2000. Joe Montana played for San Fran from 1979 to 1990 (technically until 1992 but he was injured and did not play in '91 and '92). Montana played a good six years before Rice ever got there and left a good decade before Rice left. In fact, Rice and Montana only played for five years together.
Steve Young on the other hand played for the gold diggers from 1987-1999 while really playing hall of fame ball (and even playing at all) from 1991-1998. Young played with Rice for eight years- two more than Montana.
Then we have Jeff Garcia. Garcia replaced Young and played for the 49ers from 1999-2003 where he got to play with Rice for two seasons.
Rice has 197 touchdowns. 54 of them were thrown by Montana. 84 of them were thrown by Young.
Sure, Jerry Rice has three Superbowl championships and two of them were with Montana, but the plurality of his career (oooh! My Poly Sci degree has paid off because I get to use the word "plurality") was with Steve Young, not Joe Montana.
_____________________
Here are my four big misconceptions. Please read my Matrix Revolution below for Part II.
Common Misconceptions, Part II
You can read my Part One above
Myth: Steve Bartman cost the Chicago Cubs the 2003 World Series title
Fact: Cubs errors, costly pitching, and the New York Yankees cost the Cubs the championship and pennant, not Bartman
Back Story: For all of you who think Bartman was a dick and cost the Cubs the World Series then you're a hypocrite. If you were at that game and you saw that fly ball comes towards you, you would have also reached out and would have tried to catch that ball coming towards you.
This saga has a whole lot of 1986 World Series Bill Buckner to it. All we remember is the one incident that we think was the sole reason for the team's downfall, but we forget what really happened that fateful night.
Like in the '86 World Series, the Bartman incident was Game Six. The outcome of the game was independent on who would win the series (sort of). The Cubs were winning the series 3-2 versus the Florida Marlins in the NLCS and they now had five more outs to win a trip to the World Series. Let's now go back and revisit that night. The Cubs are up 3-0 off of a brilliant performance by (the then extremely healthy) Mark Prior.
Juan Pierre is on second base and Luis Castillo hits the infamous fly ball which Steve Bartman catches. However, the Castillo at bat kept going. Because Steve Bartman caught the ball, all technically Castillo hit was a foul ball. But Cubs left fielder Moises Alou acts like a three year old and starts throwing a temper tantrum on the field. He becomes irate at Bartman because he thought he could have caught the ball that Bartman caught (Alou later admitted Castillo's fly ball out out of his reach). If Alou had just gone about his business and not brought attention to the situation then we would not be talking about this event today.
But Alou throws a hissy fit and everyone is now talking about this catch. But the score is still 3-0 and so far Prior has not given up any runs. Castillo eventually draws a walk and (due to a WP thrown in the Castillo at bat) there are runners on the corners. Pudge then hits a single making the score 3-1. Right now there are runners at second and third, one out still, and Miguel Cabrera comes to the plate.
Here is where the eighth innings stops becoming Bartman's fault and starts becoming Mark Prior's, manager Dusty Baker's, and Alex Gonzalez's fault. Because Dusty Baker is such a shit manager, he still leaves Prior in the game. A career of leaving Prior in the game too long has made Prior what he is today. Even if you believe the Bartman catch somehow rattled Prior then Baker should have pulled Prior from the game. But if you believe like I do and that Prior is a professional and was so dominant at this point in time then he should have gotten out of the inning another way.
No matter, Prior stays in the game to pitch to Cabrera. Prior did what the greats do and induced a ground ball to infielder Alex Gonzalez. What Gonzalez should have done (and easily could have done) was turned a double play so the Cubs would have gotten out of the inning up by two runs. What Gonzalez did do was bobble and misplay the ball causing Miggy to be safe at first and causing the bases to be loaded.
Then pre-wrist injury Derrek Lee comes to the plate and hits a double to tie the game. The game is not over and the Cubs still have a shot to win the game. However, the Marlins go on to score a whopping eight runs that inning and win the game 8-3.
The Marlins eventually defeated the Chicago Cubs in seven and then went on to face the New York Yankees in the World Series and became World Champs in 2003.
I was in high school in the northern suburbs of Illinois and all my friends were Cubs fans. To their credit, the vast majority of them blamed Gonzalez more than Bartman, but they were in the small minority. All you had to do was listen to five seconds of Chicago sports talk radio to hear how livid Cubs fan were at the nerdy, headphones-guy fan.
What Cubs fans and baseball fans alike seem to forgot, was that the Bartman incident was only Game Six. If the Cubs had gone out and won Game 7 then this incident would have barely been a blip on baseball history's radar. Cubs fans also forgot that Mark Prior could have gotten Luis Castillo out instead of walking him. (I mean, this is Luis Castillo we're talking about here!). Now let's say the Cubs did win in either Game Six or Game Seven, they still had to defeat the New York Yankees to become champions and there was no guarantee that would have happened.
So Cubs fans, you can blame Bartman all you want, but what you should be doing is blaming Alez Gonzalez or Dusty Baker or Mark Prior.
One last note before I move on: Let's say Bartman doesn't catch that ball. Let's say no fans reaches out to try and grab that Catillo fly ball. You wanna know what would have happened? The same thing that did happen. The ball would have been a foul ball, not been caught by Alou and Prior would still have to work to get Castillo out.
Myth: "Love Song" by Sara Bereilles was written about a former lover / significant other
Fact: The song was written to spite her record company who told her she had to write a love song to put on her record.
Back Story: "I'm not going to write you a love song / 'cause you asked for it / 'cause you need one, you see / I'm not going to write you a love song / cause you tell me it's / make or break in this"
This song makes a whole lot more sense now that you know the true meaning of it, doesn't it?
When you first listen to this song you don't really pay attention to the words. It's light, it's uplifting, it's catchy, it's bubbly, and it's got a chorus you can sing to. And then you start learning the exact words of the chorus without really paying attention to the rest of the song and you think to yourself, "Wow, this chick really must have been pissed at her old man to write this song." I mean, the only words you really know are "I'm not going to write you a love song" and you think she means she is not going to write a love song to her significant other. But you would be wrong.
According to wikipedia (the most credible source, right?):
Myth: Taking steroids means you will automatically hit 50+ home runs
Fact: All steroids does is help you increase muscle mass
Back Story: People who think that just because you stick a needle in your ass full of PED's that you will automatically hit home runs at record setting paces. Those people are retarded. I could start taking steroids or HGH right now and all that will make me do is become fatter than I already am. You still need to work out along with taking steroids if you want to actually increase your muscle mass.
Even if you do work out (like all baseball players do) and build muscle in places where no muscle should be, you still need to have talent in order to hit dingers. Carrot Top and Dr. Dre used steroids to help them become the buff fellas you see today, but you put them in the batter's box right now and all they will do is strike out faster than Adam Dunn.
People seem to forget that even if you are taking steroids you still need to work at your craft like every other baseball player. No steroids will make up for the fact that you have a giant hole in your swing or the fact you have a bad batter's eye.
I will admit that once you make contact with a ball with the extra muscle mass you have obtained from PED's then the magic elixir you have squirted into your veins makes that ball travel farther. However, you still need to have been really good at baseball beforehand in order to put up the numbers that Palmeiro, Bonds, Sosa, and McGwuire did.
Lastly, pitchers were also juicing during the steroids era. I would like to know the true effect of a 'roided pitcher facing a 'roided batter if there truly are effects favoring one side or another. If Clemons faced Bonds, does that extra few miles an hour on Clemons pitches have any effect on Bonds' faster bat swing? I truly don't know, but if you claim otherwise then you're just talking out of your ass.
Myth: Lance Armstrong did not take steroids
Fact: Lance Armstrong won all those Tour De France's because he was on steroids.
Back Story: Everyone bike racing in Armstrong's era was on steroids.
Myth: The Beatles are your favorite band
Fact: Nobody's favorite band is The Beatles
Back Story: "The Beatles are the greatest band ever but you're a liar if you say that they are your favorite" -Matt Kaplan-
Myth: Wins, ERA, and Batting Average are good metrics to determine how good a baseball player is.
Fact: They are awful, outdated, archaic metrics and should be used for fantasy purposes only
Back Story: I am not going to spend a whole lot of time on this because this is pretty obvious. Just go to fangraphs.com, thehardballtimes.com, or read anything baseball related on this site and you know how dumb these metrics truly are. I've seen a pitcher pitch go 7 IP, 0 ER and take the loss because the score was (and was when he left the game) 1-0 and the run was unearned instead of earned. Wins and loses are independent on your talent and more dependent on how good your team's offense and defense is. ERA and batting average are based largely on luck rather than how good a baseball player is. Either way, if you want to truly measure how good a baseball player is, then you can not do so by using the statistics on ESPN's MLB page.
I think old school baseball guys are finally coming around to see the light side of the force. In 2010, Felix Hernandez only won 13 games and lost 12. In 2009, Zach Grienke won 16 games and Tim Lincecum won 15. The one thing these three pitchers have in common: they all won and deserved to win their Cy Young and did so without winning the most number of games in their respected league. The notion used to be you have to win at least 20 games in order to win the Cy Young but I believe now that sabermetrics are becoming more prevalent (and the fact nobody wins 20 games anymore) and even the oldest of old school guys are coming off of their old way of thinking, sabermetrics will rule the world. That, and my eye.
Myth: Steve Bartman cost the Chicago Cubs the 2003 World Series title
Fact: Cubs errors, costly pitching, and the New York Yankees cost the Cubs the championship and pennant, not Bartman
Back Story: For all of you who think Bartman was a dick and cost the Cubs the World Series then you're a hypocrite. If you were at that game and you saw that fly ball comes towards you, you would have also reached out and would have tried to catch that ball coming towards you.
This saga has a whole lot of 1986 World Series Bill Buckner to it. All we remember is the one incident that we think was the sole reason for the team's downfall, but we forget what really happened that fateful night.
Like in the '86 World Series, the Bartman incident was Game Six. The outcome of the game was independent on who would win the series (sort of). The Cubs were winning the series 3-2 versus the Florida Marlins in the NLCS and they now had five more outs to win a trip to the World Series. Let's now go back and revisit that night. The Cubs are up 3-0 off of a brilliant performance by (the then extremely healthy) Mark Prior.
Juan Pierre is on second base and Luis Castillo hits the infamous fly ball which Steve Bartman catches. However, the Castillo at bat kept going. Because Steve Bartman caught the ball, all technically Castillo hit was a foul ball. But Cubs left fielder Moises Alou acts like a three year old and starts throwing a temper tantrum on the field. He becomes irate at Bartman because he thought he could have caught the ball that Bartman caught (Alou later admitted Castillo's fly ball out out of his reach). If Alou had just gone about his business and not brought attention to the situation then we would not be talking about this event today.
But Alou throws a hissy fit and everyone is now talking about this catch. But the score is still 3-0 and so far Prior has not given up any runs. Castillo eventually draws a walk and (due to a WP thrown in the Castillo at bat) there are runners on the corners. Pudge then hits a single making the score 3-1. Right now there are runners at second and third, one out still, and Miguel Cabrera comes to the plate.
Here is where the eighth innings stops becoming Bartman's fault and starts becoming Mark Prior's, manager Dusty Baker's, and Alex Gonzalez's fault. Because Dusty Baker is such a shit manager, he still leaves Prior in the game. A career of leaving Prior in the game too long has made Prior what he is today. Even if you believe the Bartman catch somehow rattled Prior then Baker should have pulled Prior from the game. But if you believe like I do and that Prior is a professional and was so dominant at this point in time then he should have gotten out of the inning another way.
No matter, Prior stays in the game to pitch to Cabrera. Prior did what the greats do and induced a ground ball to infielder Alex Gonzalez. What Gonzalez should have done (and easily could have done) was turned a double play so the Cubs would have gotten out of the inning up by two runs. What Gonzalez did do was bobble and misplay the ball causing Miggy to be safe at first and causing the bases to be loaded.
Then pre-wrist injury Derrek Lee comes to the plate and hits a double to tie the game. The game is not over and the Cubs still have a shot to win the game. However, the Marlins go on to score a whopping eight runs that inning and win the game 8-3.
The Marlins eventually defeated the Chicago Cubs in seven and then went on to face the New York Yankees in the World Series and became World Champs in 2003.
I was in high school in the northern suburbs of Illinois and all my friends were Cubs fans. To their credit, the vast majority of them blamed Gonzalez more than Bartman, but they were in the small minority. All you had to do was listen to five seconds of Chicago sports talk radio to hear how livid Cubs fan were at the nerdy, headphones-guy fan.
What Cubs fans and baseball fans alike seem to forgot, was that the Bartman incident was only Game Six. If the Cubs had gone out and won Game 7 then this incident would have barely been a blip on baseball history's radar. Cubs fans also forgot that Mark Prior could have gotten Luis Castillo out instead of walking him. (I mean, this is Luis Castillo we're talking about here!). Now let's say the Cubs did win in either Game Six or Game Seven, they still had to defeat the New York Yankees to become champions and there was no guarantee that would have happened.
So Cubs fans, you can blame Bartman all you want, but what you should be doing is blaming Alez Gonzalez or Dusty Baker or Mark Prior.
One last note before I move on: Let's say Bartman doesn't catch that ball. Let's say no fans reaches out to try and grab that Catillo fly ball. You wanna know what would have happened? The same thing that did happen. The ball would have been a foul ball, not been caught by Alou and Prior would still have to work to get Castillo out.
Myth: "Love Song" by Sara Bereilles was written about a former lover / significant other
Fact: The song was written to spite her record company who told her she had to write a love song to put on her record.
Back Story: "I'm not going to write you a love song / 'cause you asked for it / 'cause you need one, you see / I'm not going to write you a love song / cause you tell me it's / make or break in this"
This song makes a whole lot more sense now that you know the true meaning of it, doesn't it?
When you first listen to this song you don't really pay attention to the words. It's light, it's uplifting, it's catchy, it's bubbly, and it's got a chorus you can sing to. And then you start learning the exact words of the chorus without really paying attention to the rest of the song and you think to yourself, "Wow, this chick really must have been pissed at her old man to write this song." I mean, the only words you really know are "I'm not going to write you a love song" and you think she means she is not going to write a love song to her significant other. But you would be wrong.
According to wikipedia (the most credible source, right?):
Sara Bareilles was inspired to write "Love Song" after failing to produce successful hits, and one critic said that she needed to write "a marketable love song". Bareilles has stated that statement gave her the drive and anger necessary to write "Love Song", proving that she could indeed write a hit, and that she had no double standards.I promise you, listen closely to the words again and you will see that wikipedia and myself are right.
Myth: Taking steroids means you will automatically hit 50+ home runs
Fact: All steroids does is help you increase muscle mass
Back Story: People who think that just because you stick a needle in your ass full of PED's that you will automatically hit home runs at record setting paces. Those people are retarded. I could start taking steroids or HGH right now and all that will make me do is become fatter than I already am. You still need to work out along with taking steroids if you want to actually increase your muscle mass.
Even if you do work out (like all baseball players do) and build muscle in places where no muscle should be, you still need to have talent in order to hit dingers. Carrot Top and Dr. Dre used steroids to help them become the buff fellas you see today, but you put them in the batter's box right now and all they will do is strike out faster than Adam Dunn.
People seem to forget that even if you are taking steroids you still need to work at your craft like every other baseball player. No steroids will make up for the fact that you have a giant hole in your swing or the fact you have a bad batter's eye.
I will admit that once you make contact with a ball with the extra muscle mass you have obtained from PED's then the magic elixir you have squirted into your veins makes that ball travel farther. However, you still need to have been really good at baseball beforehand in order to put up the numbers that Palmeiro, Bonds, Sosa, and McGwuire did.
Lastly, pitchers were also juicing during the steroids era. I would like to know the true effect of a 'roided pitcher facing a 'roided batter if there truly are effects favoring one side or another. If Clemons faced Bonds, does that extra few miles an hour on Clemons pitches have any effect on Bonds' faster bat swing? I truly don't know, but if you claim otherwise then you're just talking out of your ass.
Myth: Lance Armstrong did not take steroids
Fact: Lance Armstrong won all those Tour De France's because he was on steroids.
Back Story: Everyone bike racing in Armstrong's era was on steroids.
Myth: The Beatles are your favorite band
Fact: Nobody's favorite band is The Beatles
Back Story: "The Beatles are the greatest band ever but you're a liar if you say that they are your favorite" -Matt Kaplan-
Myth: Wins, ERA, and Batting Average are good metrics to determine how good a baseball player is.
Fact: They are awful, outdated, archaic metrics and should be used for fantasy purposes only
Back Story: I am not going to spend a whole lot of time on this because this is pretty obvious. Just go to fangraphs.com, thehardballtimes.com, or read anything baseball related on this site and you know how dumb these metrics truly are. I've seen a pitcher pitch go 7 IP, 0 ER and take the loss because the score was (and was when he left the game) 1-0 and the run was unearned instead of earned. Wins and loses are independent on your talent and more dependent on how good your team's offense and defense is. ERA and batting average are based largely on luck rather than how good a baseball player is. Either way, if you want to truly measure how good a baseball player is, then you can not do so by using the statistics on ESPN's MLB page.
I think old school baseball guys are finally coming around to see the light side of the force. In 2010, Felix Hernandez only won 13 games and lost 12. In 2009, Zach Grienke won 16 games and Tim Lincecum won 15. The one thing these three pitchers have in common: they all won and deserved to win their Cy Young and did so without winning the most number of games in their respected league. The notion used to be you have to win at least 20 games in order to win the Cy Young but I believe now that sabermetrics are becoming more prevalent (and the fact nobody wins 20 games anymore) and even the oldest of old school guys are coming off of their old way of thinking, sabermetrics will rule the world. That, and my eye.
Are You Sure That's WWJD With Alex Rios?
Again, the "J" stands for Jeffrey
With every passing moment, my confidence in Alex Rios waivers that much more. What do you do with this guy?
On one hand, he is a rare .280+/20/20-type hitter, capable of the kind of balanced production that Mad Money's Jim Cramer would tout if he played fantasy baseball. On the other hand, with the exception of two, arguably three, months of his White Sox career, Alex Rios has been nothing short of atrocious. Some, including myself, lauded Alex Rios' 2010 campaign overall, attributing his second half to the universe's sick way of evening out his first half (though I do not honestly believe in the gambler's fallacy).
Having pegged Rios as a borderline OF1 in 12-team mixed leagues this year, I wonder if it is time to re-evaluate Alex Rios in the context of his 10+ month stint with the Pale Hose. First, let's examine Rios' splits by month, indexing his wOBA value against the league, weighting factors such as park (i.e., wRC+) (click to enlarge):

As you can see, Alex Rios has not been a very productive White Sox. With the exception of April and May of 2010, Rios' wRC+ has been below 100. Even if we credit Rios' June 2010 as "average," his other 7 months (plus what he's done thus far in June of this year) has been objectively poor.
Some, including myself, might be tempted to point to Rios' BABIP. At .276, it is approximately 50 points below Rios' xBABIP as a White Sox. If you adjust Rios' batting line to reflect his xBABIP, you find his expected batting average rises above the .290 threshold, with an OPS in the high .700's.
But isn't it possible that Rios' true BABIP line lie somewhere in between, perhaps closer to .270 than .325? If you take out Rios' first half from 2010 from the equation, the Rios' speed has been merely "league average" since the outset of 2009. Rios' then career-low 5.3 speed score in 2009 looks fast by the standards of his below-average 4.4 mark in 2011. Rios' declining speed is apparent by his three caught stealing and only four successful stolen bases.
Rios is 30 years old, and he's not getting younger. We like to think of hitters' peak and primes occur between their age 27 and 31 seasons, but the truth of the matter is that the talent tends to peak around age 25, followed by a plateau and decline. There really is nothing "magical" about age 27, and just because 40 is the new thirty does not make 30 the new 25. Aging curve research that I have read indicates that players in their thirties tend to lose half a WAR or so per season across their present talent line. That is not to say that Rios is Father Time, but that at age 30, his prime is likely over, the upside is quite limited, and the chances of replicating previous seasons dies with every passing year.
Given his rare 20/20 upside, promising home park, xBABIP, and brand name, it is hard to sell Rios, let alone at a substantial discount. What you get in return will hardly match the price, or contain the upside, you probably paid for with Alex Rios this year. Still, economics tells us the smart investor ignores sunk costs, and it's hardly likely Rios' reaches that level either. Last month I advised not selling yourself too short on Rios, but I am reaching the point where I am regretting that advice. If you offered me 70 cents on the dollar, I might take it.
Give his brand name, it may be possible to convince another owner that you are "selling low" and entice them to buy Alex Rios at a "fair price." If you could get a Colby Rasmus in return, I'd take it. The truth of the matter is, be it because of age or injury, .265/.310/.420 might be all that Rios has got left in the tank at the moment. Rios could touch the 15/15 mark this season, but 12/12 is probably more realistic. Shoot for upside, aim for prospects. I flipped Rios for Anthony Rizzo and Aaron Crow in a league on Tuesday.
So get out there, try and make a trade. Or readjust your expectations. Just don't keep Rios and expect a major bounce back.
With every passing moment, my confidence in Alex Rios waivers that much more. What do you do with this guy?
On one hand, he is a rare .280+/20/20-type hitter, capable of the kind of balanced production that Mad Money's Jim Cramer would tout if he played fantasy baseball. On the other hand, with the exception of two, arguably three, months of his White Sox career, Alex Rios has been nothing short of atrocious. Some, including myself, lauded Alex Rios' 2010 campaign overall, attributing his second half to the universe's sick way of evening out his first half (though I do not honestly believe in the gambler's fallacy).
Having pegged Rios as a borderline OF1 in 12-team mixed leagues this year, I wonder if it is time to re-evaluate Alex Rios in the context of his 10+ month stint with the Pale Hose. First, let's examine Rios' splits by month, indexing his wOBA value against the league, weighting factors such as park (i.e., wRC+) (click to enlarge):

As you can see, Alex Rios has not been a very productive White Sox. With the exception of April and May of 2010, Rios' wRC+ has been below 100. Even if we credit Rios' June 2010 as "average," his other 7 months (plus what he's done thus far in June of this year) has been objectively poor.
Some, including myself, might be tempted to point to Rios' BABIP. At .276, it is approximately 50 points below Rios' xBABIP as a White Sox. If you adjust Rios' batting line to reflect his xBABIP, you find his expected batting average rises above the .290 threshold, with an OPS in the high .700's.
But isn't it possible that Rios' true BABIP line lie somewhere in between, perhaps closer to .270 than .325? If you take out Rios' first half from 2010 from the equation, the Rios' speed has been merely "league average" since the outset of 2009. Rios' then career-low 5.3 speed score in 2009 looks fast by the standards of his below-average 4.4 mark in 2011. Rios' declining speed is apparent by his three caught stealing and only four successful stolen bases.
Rios is 30 years old, and he's not getting younger. We like to think of hitters' peak and primes occur between their age 27 and 31 seasons, but the truth of the matter is that the talent tends to peak around age 25, followed by a plateau and decline. There really is nothing "magical" about age 27, and just because 40 is the new thirty does not make 30 the new 25. Aging curve research that I have read indicates that players in their thirties tend to lose half a WAR or so per season across their present talent line. That is not to say that Rios is Father Time, but that at age 30, his prime is likely over, the upside is quite limited, and the chances of replicating previous seasons dies with every passing year.
Given his rare 20/20 upside, promising home park, xBABIP, and brand name, it is hard to sell Rios, let alone at a substantial discount. What you get in return will hardly match the price, or contain the upside, you probably paid for with Alex Rios this year. Still, economics tells us the smart investor ignores sunk costs, and it's hardly likely Rios' reaches that level either. Last month I advised not selling yourself too short on Rios, but I am reaching the point where I am regretting that advice. If you offered me 70 cents on the dollar, I might take it.
Give his brand name, it may be possible to convince another owner that you are "selling low" and entice them to buy Alex Rios at a "fair price." If you could get a Colby Rasmus in return, I'd take it. The truth of the matter is, be it because of age or injury, .265/.310/.420 might be all that Rios has got left in the tank at the moment. Rios could touch the 15/15 mark this season, but 12/12 is probably more realistic. Shoot for upside, aim for prospects. I flipped Rios for Anthony Rizzo and Aaron Crow in a league on Tuesday.
So get out there, try and make a trade. Or readjust your expectations. Just don't keep Rios and expect a major bounce back.
The Best TV Shows of 2011: Summer Edition
You can see my best of 2010 list here
I was planning on writing posts for TV and music singles at the end of June to celebrate six months done and six months to go, but I'm writing my TV post a few weeks early because the spring line ups are all done and the summer line ups are just getting under way, so instead of writing a post where some shows will only be an episode or two into their season versus other shows that are completely done, I'm going to do my half way post now. Plus, I'm really bored and I already saw one movie today in lieu of my goal to see every movie on AFI's top 100 list by the end of the summer (I have 59 more movies to go).
A disclaimer before I begin: While I do watch an unnecessary amount of television, I obviously do not watch every single show like many, actual TV critics. You will notice that many of my shows come mainly from two channels: FX and NBC- for several reasons. First, I watch a lot of On Demand and those two stations along with USA are probably the three best channels to watch all of their shows On Demand. ABC finally got their act together and posted some of their shows On Demand, but not a whole lot and you can not fast forward through commercials through ABC (or FOX) like you can with NBC, USA, and FX. CBS is pretty good at their On Demand stuff but I don't watch a whole lot of CBS because I don't like a whole lot of shows they offer. Which leads me to my second point, there's a lot of crap out there and this has been an extremely weak spring line up. The most watched new show (which is purposefully omitted from this list) is Hawaii 5-0 (CBS). While a lot of people are watching the show, it has far inferior numbers compared to its new show counterparts even three, five years ago- which just goes to show you the poor quality of new programs so far. (Want more further proof, just listen to how "excited" Bill Simmons is about recent new shows when he has the great TV critic from hitfix.com Alan Sepinwall on The B.S. Report). Next, many of the shows I like and just great shows in general like Mad Men, Breaking Bad, Entourage, and The League, just to name a few, did not have a season in 2011. Lastly, I do not get HBO, Showtime, or any premium network so shows like Dexter (which I have heard bad things about for its fifth season) and Game Of Thrones (which I have heard great things about but it's hard for me to get interested in medieval pieces) I can not easily watch.
So after my long-winded nothingness, let's get on with the list.
***Warning, posts may contain spoilers***
 10) Law and Order: LA (NBC)
Admittedly the main reason I started watching this show was because it was On Demand, but being in law school (which actually helped me understand more about the investigation of the murder than the trial itself- which as a lawyer-in-training the trials just frustrate me more than anything. But I digress.) helped me enjoy this version of Law and Order. The season started off very slow and annoying and the show didn't really get a good feel for what it wanted to do. It had both Terrence Howard and Alfred Molina as the D.A. and the show seemed to try and coast on the allure of crimes in Los Angeles. Then, halfway through the series, one of the lead detectives, Rex Winters (Skeet Ulrich) was murdered and the show changed for the better. Alfred Molina became a detective, Terrence Howard played the main attorney and the show added Alena De La Garza who played D.A. Rubirosa at the end of the original Law and Order run to become Howard's assistant and the voice of reason and morality. (SIDENOTE: As an actual attorney, you can't just practice in one state then up and leave to practice in another- you have to take a new bar for every state you want to practice in. But hey, that's the magic of television). Anyways, since the change the show reverted back to its glory days of aggressive prosection and a giant twist at the end of every episode. Just one of the many shows I like (and on this list) that gets cancelled after one season. Although I'm sure creator Dick Wolf isn't all that broken up about it while he is counting his millions of dollars that he's made from this franchise.
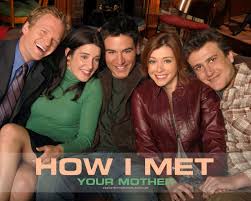 9) How I Met Your Mother (CBS)
How I Met Your Mother (HIMYM) took the biggest dive being the best comedy of last year in the number two slot dropping all the way down to nine. I thought HIMYM had a really bad year in Season 6. Don't get me wrong, the season had some great, fantastic moments, mainly centered around the fathers of the shows two best characters Marshall (Jason Segel) and Barney (Neil Patrick Harris).
HIMYM suffers from two fatal flaws as it keeps getting renewed (CBS renewed it for at least another two seasons). The first is that the show centers around Ted Mosby (Josh Radnor) who is in my opinion the worst character out of the five main ones. The vast majority of people think the best are either Marshall or Barney so despite where you think Ted ranks, the fact that he's probably your third favorite character at best yet also the lead says a lot of things about the show. To me, Ted is like J.D. from Scrubs, he kind of sucks but he's the glue that holds the awesome supporting cast cast members in place. The second (and I think biggest) flaw going six seasons deep is that the show has dug itself into a hole calling it "How I Met Your Mother". If this show had a different title yet told the same exact jokes except older Ted (voiced by Bob Saget) was telling his kids about his youth instead how how he met his wife, then I think the show would have been better by this point. Seriously, if you were one of those kids how pissed would you be if your dad told a three week story? The show now has to center around Ted and his relationships which hurt the show this season.
This season centered around the relationship between Ted and his girlfriend Zoey (Jennifer Morrison a.k.a Cameron on "House"). The relationship did nothing to advance the character development of Ted (in fact it seemed to hurt it) nor did it in any way explain why you would tell your kids this story in how you met your wife.
If I could I would have left HIMYM off of my list but by default it's in and I'm confident that when my end of the year list comes out How I Met Your Mother will not be on it. But because it is so ingrained in our culture, I still laugh at it, and the stuff that worked was really good, HIMYM earned the 9th spot on this list.
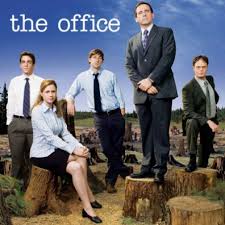 8) The Office (NBC)
The Office moves up from barely cracking the top 10 in 2010 (at #10) to now being solidly in there at number eight.
This year was Michael Scott's last season on the show so Steve Carrel can go out and make more shitty movies that aren't funny but I'm sure pay him a helluva lot more than what he made doing television. At this point in The Office I've stopped comparing the show to Seasons 2-4 because you're always going to get let down if you do that, but the Michael Scott farewell tour was poignant, beautiful and funny. You have truly seen how Michael Scott (Carrel) has involved into the asshole he once was in the beginning of the season into one of the best bosses a guy could have at the time of his departure. Now the only question that remains is: who will become the new boss of Dunder Mifflin in Scranton? My vote is for Darryl (Craig Robinson) but based upon how awesome James Spader was in his interview in the season finale, I think I might like to see him be the new boss. (Same as the old boss? Not a The Who fan? Oh well, moving on).
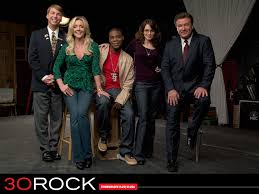 7) 30 Rock (NBC)
30 Rock is back! There was a huge stretch there where I was only watching the show because it was just second nature to me and not because it was funny. The season stumbled a bit when Tracy Morgan had kidney surgery thus forcing Tracy Jordan (Morgan) to take a hiatus from TGS but as a whole, 30 Rock had a great season. The show reverted back to what made it good in the first place- Jack Donaghy (Alec Baldwin) being high and mighty, Liz Lemon (Tina Fey) having problems in her social life, developing the relationship between Jack and Liz, and having only bit parts for the writers of TGS and Kenneth (Jack McBrayer). The show took a huge step in the right direction as it moved from #15 in 2010 to cracking the top 10 in 2011. The show is still not as funny as it was in Seasons 1-3 which was somewhat disappointing to me because I have such high expectations for this show based on when it first came out, but overall Season 5 of 30 Rock was funny and a success and earned the number seven spot on this list.
 6) Community (NBC)
I write these posts from 1 to 10 instead of from 10 to 1 so by this point I have already written five pieces and the length is starting to get long. I will say this about Community though. While this show is probably the smartest comedy on television right now, the biggest problem I had with them in Season 2 is that they had a lot of unfunny episodes this season, especially during the middle of the season. The show was and always has been extremely well-written but a lot of episodes used that smart writing for character development instead of humor. Unlike shows in which you'll read about later, I think Community took a slight step back this season. I know there are a lot of people who really enjoyed Community this season much more than I did and really appreciated the intelligence of the show, even when it wasn't funny, but silly me to ask for humor when I watch a comedy television program. But despite my little negative rant, the show still had some fantastic moments (most notably the two part paintball episodes to end the season) and just for being so cutting edge and original, Community earns the number six spot on this list, up from number nine last year.
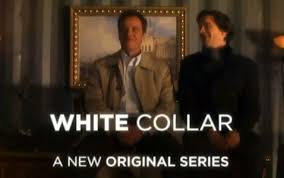 5) White Collar (USA)
What, that many NBC shows in a row is just too jarring for you? OK, let's take a break.
White Collar moved up from the 8th best show of 2010 to my 5th best of 2011. The show follows along white collar expert in the FBI Special Agent Peter Burke (Tim DeKay) and smooth talking Ocean's-11-George-Clooney-esque con man Neil Caffrey (Matt Bomer) as a tag team duo catching a different white collar criminal week to week.
Like all original USA shows (and unlike FX shows) they are not *that* well written and are very formulaic and always have a happy ending but what I especially enjoyed about Season 2 of White Collar (especially the parts shown in 2011) was that it finally wrapped up the series long conflict of what happened to Kate / why everyone was searching for the music box.
Sometimes you need mindless TV which will always put a smile on your face which is why White Collar earned the fifth best spot on this list.
 4) Lights Out (FX)
FX is probably the best network out there in terms of original programming but it's sadly a station that nobody watches. AMC is the big up and coming station with two great and established shows such as Mad Men and Breaking Bad and even still AMC is having trouble attracting viewers. Needless to say FX is in trouble. Whether it is a sports team or a TV station, the best way to attract people to watch you is by putting out quality products. But as the Tampa Bay Rays as well as FX has learned, that philosophy has not always paid off. The best show of 2010 was an FX show called Terriers which got cancelled due to poor ratings and Lights Out unfortunately fell to the same fate.
Lights Out follows boxer and former heavyweight champion Patrick "Lights" Leary (Holt McCallany) from him scrapping the bottom of the barrel (and lower) to try and regain his glory days back at the top. Even with boxing movies such as Rocky, Raging Bull, Cinderella Man, and most recently The Fighter, Lights Out felt original- mainly because nothing could go right for this underdog whereas the underdog always wins in the movies. Even when good things happened to Lights Leary and his family, even worse things would just pile on top and ruin everything again.
I encourage all of you to check out this show so I won't completely ruin the ending for you (which was jaw-dropping and amazing and heart breaking all at the same time) but even though the season ended like it was expecting a second season, it was a perfect series finale and the show was great enough to be the 4th best show of 2011 so far.
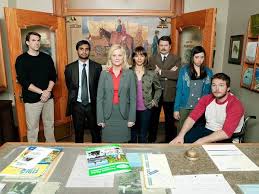 3) Parks and Recreation (NBC)
Parks and Rec has done a lot of things to make sure people don't watch it. First, they had an awful first season which almost made me stop watching the show forever if it wasn't for DME showing me how awesome Season 2 was. Then, it took them 16 months between the start of Season 2 to the start of Season 3 which made me not rank the show in my final end of the year column for 2010 (although it was 7th in my mid-year column) but it is back now and Season 4 is expected to start back up in the fall. (I will say though in Parks and Recs defense that I'm pretty sure the huge gap between Season 2 and Season 3 was because Amy Poehler got preggers. Oh well.)
Parks and Rec follows around Leslie Knope (Poehler) in a governmental parks department in the small town of Pawnee, Indiana. The concept of the show is nothing exciting or special but the casting and characters around Leslie Knope are great. They range from one of my favorite stand up comedians right now Aziz Ansari to Reshida Jones (who played Karen on The Office) to Aubrey Plaza (the stand up comedian chick in Funny People). Season 3 also starred the fantastic Rob Lowe with Adam Scott (the brother of Will Ferrell in Stepbrothers) which added great conflict for the second half of the show. But the best character is the head of the Parks Department Ron Swanson (Nick Offerman) who is Leslie's boss and is a true libertarian who doesn't believe in big government (or that any government should ever have a parks department for that matter).
Season 3 centers around the Parks department and the town of Pawnee getting out of financial debt but really, the show and cast are just hilarious no matter what situation they are in and the show has been consistently great and funny all season long which is why it earns the #3 spot on this list.
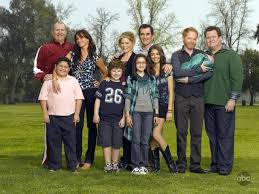 2) Modern Family (ABC)
For my past two posts (the two for 2010) the best comedy has landed in the number two hole. I think it is just hard to rank the best comedy number one ahead of the best drama, as is true here. But make no mistake, the best comedy, here being Modern Family, is just as good in its own right.
Modern Family moved up nine spots from the eleventh best show of 2010 to my second best show of 2011.
Modern Family is not On Demand so the fact that I go out of my way to watch this show should give you an indication of just how good and hilarious the show is. Modern Family is one of a few examples on this list to make a great leap from Season One to Season Two. The show has always been funny but now that everybody has a firm grip on their characters (although Modern Family really wasn't one of the many shows to suffer from a lack of voice in its first season) this show is not only more hilarious but has deep heart and you're able to connect with its decently big cast (six adults and four kids spread across three families and generally at least three story lines an episode) along with building relationships between all the characters within the show.
The weird thing about Modern Family is that I can't really quote major lines from the show. Those who personally know me know I love to quote (or at least attempt to quote because I generally get the quote wrong) my favorite things and yet I can't do it with Modern Family. Just trust me though, the show is fucking hilarious and brilliant and deserves to be the best comedy of 2011 and the second best show of the year so far.
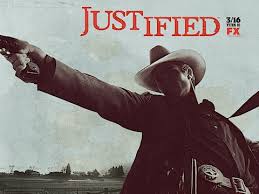 1) Justified (FX)
Jumping up four spots from my fifth best show last year to the best show so far this year, Justified's sophomore season has far surpassed its rookie one to rightfully earn the top honor.
Out of my millions of facebook friends (and by millions I mean 172. Don't feel bad, I purposefully delete those who I will never talk to again) only two of them watch Justified- and only one of them I actually continually converse with. So you need to watch Justified for the sole reason so that I have somebody to talk about this show with.
But in all seriousness Justified is amazing and you need to watch it.
The show follows around Raylan Givens (Timothy Olyphant) as a bad-ass U.S. Marshall stuck back in his hometown of Harlan County, Kentucky. The season started off slow (although it had a great premiere giving closure to the end of Season 1 while setting up the characters and story lines for Season 2) it picked up about five episodes into the season stepped on the pedal, hit a few babies and old ladies along the way, and never looked back with its last four episodes of the season being some of the best television in awhile. Three out of the last four episodes could have been the season finale for me (although one actually WAS the season finale) and each episode was just better than the last.
Season 2 mainly centered around Olyphany versus Mags Bennett (Margo Martingale) who is a rotund (to put it lightly) 60-ish year old lady who runs the weed business in Harlan County versus Boyd Crowder (Walton Goggins), the bad guy from Season 1, and the Crowder clan. Mags and Boyd Crowder play some of the best and charismatic bad guys on television, but my favorite was one in Season 2 was one of Mags' son- Dickie Bennett (Jeremy Davies). They all just pull you into every scene they're in while being some of the ruthless, ill-hearted people around. You still want them to win yet also want Raylan to kick their ass.
I loved Season 2 and the leap Justified took and, as mentioned earlier in the post, along with some great shows not even airing in 2011, I think it's going to be hard to knock Justified out of the top spot by year's end.
__________________________
Here is a recap of my list:
10) Law and Order: Los Angeles (NBC)
9) How I Met Your Mother (CBS)
8) The Office (NBC)
7) 30 Rock (NBC)
6) Community (NBC)
5) White Collar (USA)
4) Lights Out (FX)
3) Parks and Recreation (NBC)
2) Modern Family (ABC)
1) Justified (FX)
I was planning on writing posts for TV and music singles at the end of June to celebrate six months done and six months to go, but I'm writing my TV post a few weeks early because the spring line ups are all done and the summer line ups are just getting under way, so instead of writing a post where some shows will only be an episode or two into their season versus other shows that are completely done, I'm going to do my half way post now. Plus, I'm really bored and I already saw one movie today in lieu of my goal to see every movie on AFI's top 100 list by the end of the summer (I have 59 more movies to go).
A disclaimer before I begin: While I do watch an unnecessary amount of television, I obviously do not watch every single show like many, actual TV critics. You will notice that many of my shows come mainly from two channels: FX and NBC- for several reasons. First, I watch a lot of On Demand and those two stations along with USA are probably the three best channels to watch all of their shows On Demand. ABC finally got their act together and posted some of their shows On Demand, but not a whole lot and you can not fast forward through commercials through ABC (or FOX) like you can with NBC, USA, and FX. CBS is pretty good at their On Demand stuff but I don't watch a whole lot of CBS because I don't like a whole lot of shows they offer. Which leads me to my second point, there's a lot of crap out there and this has been an extremely weak spring line up. The most watched new show (which is purposefully omitted from this list) is Hawaii 5-0 (CBS). While a lot of people are watching the show, it has far inferior numbers compared to its new show counterparts even three, five years ago- which just goes to show you the poor quality of new programs so far. (Want more further proof, just listen to how "excited" Bill Simmons is about recent new shows when he has the great TV critic from hitfix.com Alan Sepinwall on The B.S. Report). Next, many of the shows I like and just great shows in general like Mad Men, Breaking Bad, Entourage, and The League, just to name a few, did not have a season in 2011. Lastly, I do not get HBO, Showtime, or any premium network so shows like Dexter (which I have heard bad things about for its fifth season) and Game Of Thrones (which I have heard great things about but it's hard for me to get interested in medieval pieces) I can not easily watch.
So after my long-winded nothingness, let's get on with the list.
***Warning, posts may contain spoilers***
Admittedly the main reason I started watching this show was because it was On Demand, but being in law school (which actually helped me understand more about the investigation of the murder than the trial itself- which as a lawyer-in-training the trials just frustrate me more than anything. But I digress.) helped me enjoy this version of Law and Order. The season started off very slow and annoying and the show didn't really get a good feel for what it wanted to do. It had both Terrence Howard and Alfred Molina as the D.A. and the show seemed to try and coast on the allure of crimes in Los Angeles. Then, halfway through the series, one of the lead detectives, Rex Winters (Skeet Ulrich) was murdered and the show changed for the better. Alfred Molina became a detective, Terrence Howard played the main attorney and the show added Alena De La Garza who played D.A. Rubirosa at the end of the original Law and Order run to become Howard's assistant and the voice of reason and morality. (SIDENOTE: As an actual attorney, you can't just practice in one state then up and leave to practice in another- you have to take a new bar for every state you want to practice in. But hey, that's the magic of television). Anyways, since the change the show reverted back to its glory days of aggressive prosection and a giant twist at the end of every episode. Just one of the many shows I like (and on this list) that gets cancelled after one season. Although I'm sure creator Dick Wolf isn't all that broken up about it while he is counting his millions of dollars that he's made from this franchise.
How I Met Your Mother (HIMYM) took the biggest dive being the best comedy of last year in the number two slot dropping all the way down to nine. I thought HIMYM had a really bad year in Season 6. Don't get me wrong, the season had some great, fantastic moments, mainly centered around the fathers of the shows two best characters Marshall (Jason Segel) and Barney (Neil Patrick Harris).
HIMYM suffers from two fatal flaws as it keeps getting renewed (CBS renewed it for at least another two seasons). The first is that the show centers around Ted Mosby (Josh Radnor) who is in my opinion the worst character out of the five main ones. The vast majority of people think the best are either Marshall or Barney so despite where you think Ted ranks, the fact that he's probably your third favorite character at best yet also the lead says a lot of things about the show. To me, Ted is like J.D. from Scrubs, he kind of sucks but he's the glue that holds the awesome supporting cast cast members in place. The second (and I think biggest) flaw going six seasons deep is that the show has dug itself into a hole calling it "How I Met Your Mother". If this show had a different title yet told the same exact jokes except older Ted (voiced by Bob Saget) was telling his kids about his youth instead how how he met his wife, then I think the show would have been better by this point. Seriously, if you were one of those kids how pissed would you be if your dad told a three week story? The show now has to center around Ted and his relationships which hurt the show this season.
This season centered around the relationship between Ted and his girlfriend Zoey (Jennifer Morrison a.k.a Cameron on "House"). The relationship did nothing to advance the character development of Ted (in fact it seemed to hurt it) nor did it in any way explain why you would tell your kids this story in how you met your wife.
If I could I would have left HIMYM off of my list but by default it's in and I'm confident that when my end of the year list comes out How I Met Your Mother will not be on it. But because it is so ingrained in our culture, I still laugh at it, and the stuff that worked was really good, HIMYM earned the 9th spot on this list.
The Office moves up from barely cracking the top 10 in 2010 (at #10) to now being solidly in there at number eight.
This year was Michael Scott's last season on the show so Steve Carrel can go out and make more shitty movies that aren't funny but I'm sure pay him a helluva lot more than what he made doing television. At this point in The Office I've stopped comparing the show to Seasons 2-4 because you're always going to get let down if you do that, but the Michael Scott farewell tour was poignant, beautiful and funny. You have truly seen how Michael Scott (Carrel) has involved into the asshole he once was in the beginning of the season into one of the best bosses a guy could have at the time of his departure. Now the only question that remains is: who will become the new boss of Dunder Mifflin in Scranton? My vote is for Darryl (Craig Robinson) but based upon how awesome James Spader was in his interview in the season finale, I think I might like to see him be the new boss. (Same as the old boss? Not a The Who fan? Oh well, moving on).
30 Rock is back! There was a huge stretch there where I was only watching the show because it was just second nature to me and not because it was funny. The season stumbled a bit when Tracy Morgan had kidney surgery thus forcing Tracy Jordan (Morgan) to take a hiatus from TGS but as a whole, 30 Rock had a great season. The show reverted back to what made it good in the first place- Jack Donaghy (Alec Baldwin) being high and mighty, Liz Lemon (Tina Fey) having problems in her social life, developing the relationship between Jack and Liz, and having only bit parts for the writers of TGS and Kenneth (Jack McBrayer). The show took a huge step in the right direction as it moved from #15 in 2010 to cracking the top 10 in 2011. The show is still not as funny as it was in Seasons 1-3 which was somewhat disappointing to me because I have such high expectations for this show based on when it first came out, but overall Season 5 of 30 Rock was funny and a success and earned the number seven spot on this list.
I write these posts from 1 to 10 instead of from 10 to 1 so by this point I have already written five pieces and the length is starting to get long. I will say this about Community though. While this show is probably the smartest comedy on television right now, the biggest problem I had with them in Season 2 is that they had a lot of unfunny episodes this season, especially during the middle of the season. The show was and always has been extremely well-written but a lot of episodes used that smart writing for character development instead of humor. Unlike shows in which you'll read about later, I think Community took a slight step back this season. I know there are a lot of people who really enjoyed Community this season much more than I did and really appreciated the intelligence of the show, even when it wasn't funny, but silly me to ask for humor when I watch a comedy television program. But despite my little negative rant, the show still had some fantastic moments (most notably the two part paintball episodes to end the season) and just for being so cutting edge and original, Community earns the number six spot on this list, up from number nine last year.
What, that many NBC shows in a row is just too jarring for you? OK, let's take a break.
White Collar moved up from the 8th best show of 2010 to my 5th best of 2011. The show follows along white collar expert in the FBI Special Agent Peter Burke (Tim DeKay) and smooth talking Ocean's-11-George-Clooney-esque con man Neil Caffrey (Matt Bomer) as a tag team duo catching a different white collar criminal week to week.
Like all original USA shows (and unlike FX shows) they are not *that* well written and are very formulaic and always have a happy ending but what I especially enjoyed about Season 2 of White Collar (especially the parts shown in 2011) was that it finally wrapped up the series long conflict of what happened to Kate / why everyone was searching for the music box.
Sometimes you need mindless TV which will always put a smile on your face which is why White Collar earned the fifth best spot on this list.
FX is probably the best network out there in terms of original programming but it's sadly a station that nobody watches. AMC is the big up and coming station with two great and established shows such as Mad Men and Breaking Bad and even still AMC is having trouble attracting viewers. Needless to say FX is in trouble. Whether it is a sports team or a TV station, the best way to attract people to watch you is by putting out quality products. But as the Tampa Bay Rays as well as FX has learned, that philosophy has not always paid off. The best show of 2010 was an FX show called Terriers which got cancelled due to poor ratings and Lights Out unfortunately fell to the same fate.
Lights Out follows boxer and former heavyweight champion Patrick "Lights" Leary (Holt McCallany) from him scrapping the bottom of the barrel (and lower) to try and regain his glory days back at the top. Even with boxing movies such as Rocky, Raging Bull, Cinderella Man, and most recently The Fighter, Lights Out felt original- mainly because nothing could go right for this underdog whereas the underdog always wins in the movies. Even when good things happened to Lights Leary and his family, even worse things would just pile on top and ruin everything again.
I encourage all of you to check out this show so I won't completely ruin the ending for you (which was jaw-dropping and amazing and heart breaking all at the same time) but even though the season ended like it was expecting a second season, it was a perfect series finale and the show was great enough to be the 4th best show of 2011 so far.
Parks and Rec has done a lot of things to make sure people don't watch it. First, they had an awful first season which almost made me stop watching the show forever if it wasn't for DME showing me how awesome Season 2 was. Then, it took them 16 months between the start of Season 2 to the start of Season 3 which made me not rank the show in my final end of the year column for 2010 (although it was 7th in my mid-year column) but it is back now and Season 4 is expected to start back up in the fall. (I will say though in Parks and Recs defense that I'm pretty sure the huge gap between Season 2 and Season 3 was because Amy Poehler got preggers. Oh well.)
Parks and Rec follows around Leslie Knope (Poehler) in a governmental parks department in the small town of Pawnee, Indiana. The concept of the show is nothing exciting or special but the casting and characters around Leslie Knope are great. They range from one of my favorite stand up comedians right now Aziz Ansari to Reshida Jones (who played Karen on The Office) to Aubrey Plaza (the stand up comedian chick in Funny People). Season 3 also starred the fantastic Rob Lowe with Adam Scott (the brother of Will Ferrell in Stepbrothers) which added great conflict for the second half of the show. But the best character is the head of the Parks Department Ron Swanson (Nick Offerman) who is Leslie's boss and is a true libertarian who doesn't believe in big government (or that any government should ever have a parks department for that matter).
Season 3 centers around the Parks department and the town of Pawnee getting out of financial debt but really, the show and cast are just hilarious no matter what situation they are in and the show has been consistently great and funny all season long which is why it earns the #3 spot on this list.
For my past two posts (the two for 2010) the best comedy has landed in the number two hole. I think it is just hard to rank the best comedy number one ahead of the best drama, as is true here. But make no mistake, the best comedy, here being Modern Family, is just as good in its own right.
Modern Family moved up nine spots from the eleventh best show of 2010 to my second best show of 2011.
Modern Family is not On Demand so the fact that I go out of my way to watch this show should give you an indication of just how good and hilarious the show is. Modern Family is one of a few examples on this list to make a great leap from Season One to Season Two. The show has always been funny but now that everybody has a firm grip on their characters (although Modern Family really wasn't one of the many shows to suffer from a lack of voice in its first season) this show is not only more hilarious but has deep heart and you're able to connect with its decently big cast (six adults and four kids spread across three families and generally at least three story lines an episode) along with building relationships between all the characters within the show.
The weird thing about Modern Family is that I can't really quote major lines from the show. Those who personally know me know I love to quote (or at least attempt to quote because I generally get the quote wrong) my favorite things and yet I can't do it with Modern Family. Just trust me though, the show is fucking hilarious and brilliant and deserves to be the best comedy of 2011 and the second best show of the year so far.
Jumping up four spots from my fifth best show last year to the best show so far this year, Justified's sophomore season has far surpassed its rookie one to rightfully earn the top honor.
Out of my millions of facebook friends (and by millions I mean 172. Don't feel bad, I purposefully delete those who I will never talk to again) only two of them watch Justified- and only one of them I actually continually converse with. So you need to watch Justified for the sole reason so that I have somebody to talk about this show with.
But in all seriousness Justified is amazing and you need to watch it.
The show follows around Raylan Givens (Timothy Olyphant) as a bad-ass U.S. Marshall stuck back in his hometown of Harlan County, Kentucky. The season started off slow (although it had a great premiere giving closure to the end of Season 1 while setting up the characters and story lines for Season 2) it picked up about five episodes into the season stepped on the pedal, hit a few babies and old ladies along the way, and never looked back with its last four episodes of the season being some of the best television in awhile. Three out of the last four episodes could have been the season finale for me (although one actually WAS the season finale) and each episode was just better than the last.
Season 2 mainly centered around Olyphany versus Mags Bennett (Margo Martingale) who is a rotund (to put it lightly) 60-ish year old lady who runs the weed business in Harlan County versus Boyd Crowder (Walton Goggins), the bad guy from Season 1, and the Crowder clan. Mags and Boyd Crowder play some of the best and charismatic bad guys on television, but my favorite was one in Season 2 was one of Mags' son- Dickie Bennett (Jeremy Davies). They all just pull you into every scene they're in while being some of the ruthless, ill-hearted people around. You still want them to win yet also want Raylan to kick their ass.
I loved Season 2 and the leap Justified took and, as mentioned earlier in the post, along with some great shows not even airing in 2011, I think it's going to be hard to knock Justified out of the top spot by year's end.
__________________________
Here is a recap of my list:
10) Law and Order: Los Angeles (NBC)
9) How I Met Your Mother (CBS)
8) The Office (NBC)
7) 30 Rock (NBC)
6) Community (NBC)
5) White Collar (USA)
4) Lights Out (FX)
3) Parks and Recreation (NBC)
2) Modern Family (ABC)
1) Justified (FX)
Making sense of xWHIP through the power of relativity
The following is my latest article for The Hardball Times.
Before reading this article, I encourage you to read my earlier xWHIP and eFIP; this is an extension of the data presented from it. All statistics are current through May 27.
Earlier this week, I presented an updated form of my xWHIP Calculator, which, with the power of normalization, calculates a pitcher's expected hits and expected innings based on his batted ball profile. In raw form, I presented various data points for both xWHIP and eFIP. While useful, such absolutes can be hard to interpret. What does a 1.16 xWHIP mean in isolation? Particularly with the low variance in WHIP in baseball (the range tends to be largely between 1.10 and 1.50), small differences in WHIP can make a larger difference than you might think.
To address these problems, I have calculated each player's xWHIP Z-Score to give some sense of relativity. Because we are dealing with pitchers, where lower is better, I calculated the data so that the lowest Z-Scores equate the best impact players, while higher Z-Scores indicate the worst players with the biggest impact. I also tabulated a column of weighted Z-Scores scaled to expected innings pitched through May 27. This will give you some sense of which players should, in theory, have had the biggest impact on WHIP through the first two months of the season.
Because this column is weighted based on expected innings to date, which may vary in the future based on past playing time, it should not necessarily be consulted in evaluating a player's prospects (e.g., Zack Greinke has the highest Z-Score at -1.98, but only a -1.22 weighted score due to his limited number of relative starts to begin the season). For future value, you should consult the player's unweighted Z-Score, which should be scaled based on relative expected future innings. For example, if pitcher A is expected to pitch 20 percent more innings than the average full-time starter for the rest of the season, his Z-Score should be adjusted accordingly.
To make the data easier to interpret, particularly because I am using Z-Scores in lieu of an index (this was done because of pitcher clustering; the Z-Score calculations give a better sense of impact and relativity for xWHIP), I color-coordinated the data below.
Orange cells mean that the pitcher is in the upper echelon of the relevant column. For xWHIP, this means the pitcher has an xWHIP below 1.27. For dWHIP (the difference between actual WHIP and xWHIP), this means that the pitcher's xWHIP is at least 0.05 points lower than his actual WHIP to date. For Z-Scores, it means the pitcher has an xWHIP Z-Score of -0.35 or lower. These are likely pitchers to target for acquisition, particularly if one or more of his xWHIP, dWHIP, or Z-Score is colored orange.
Blue cells mean that the pitcher is in the lower tier of the relevant column. For xWHIP, this means the pitcher has an xWHIP of or above 1.34. For dWHIP, this means that the pitcher's xWHIP is at least 0.05 points higher than his actual WHIP to date. For Z-Scores, it means the pitcher has a Z-Score of +0.35 or above. These are likely pitchers to avoid or trade, particularly if one or more of his xWHIP, dWHIP, or Z-Score is colored blue.
Yellow cells are "neutral." These are players who are unlikely to have any significant impact on your team's future WHIP, for better or worse. The xWHIP threshold for neutrality is 1.27 to 1.33. I chose 1.27 as the lower end of the xWHIP threshold, despite the fact that the league average xWHIP is 1.33, because the sample of fantasy players in use is a subset of the starting pitching population. The worst pitchers in the league are unlikely to be on a fantasy roster, and at the same time are likely to post the highest WHIPs. In my preseason E.Y.E.S. post about how to calculate auction values, I tabulated the league average fantasy player's WHIP at 1.265. Because starters tend to have a higher WHIPs than relievers on average (expected mean starter WHIP was 1.30), I am using 1.27 as the lower bound of neutrality.
That all noted, here is a visually organized presentation of the data. The left set of data is organized by xWHIP, while the right set of data is organized by dWHIP (you'll need to click the image to enlarge it):
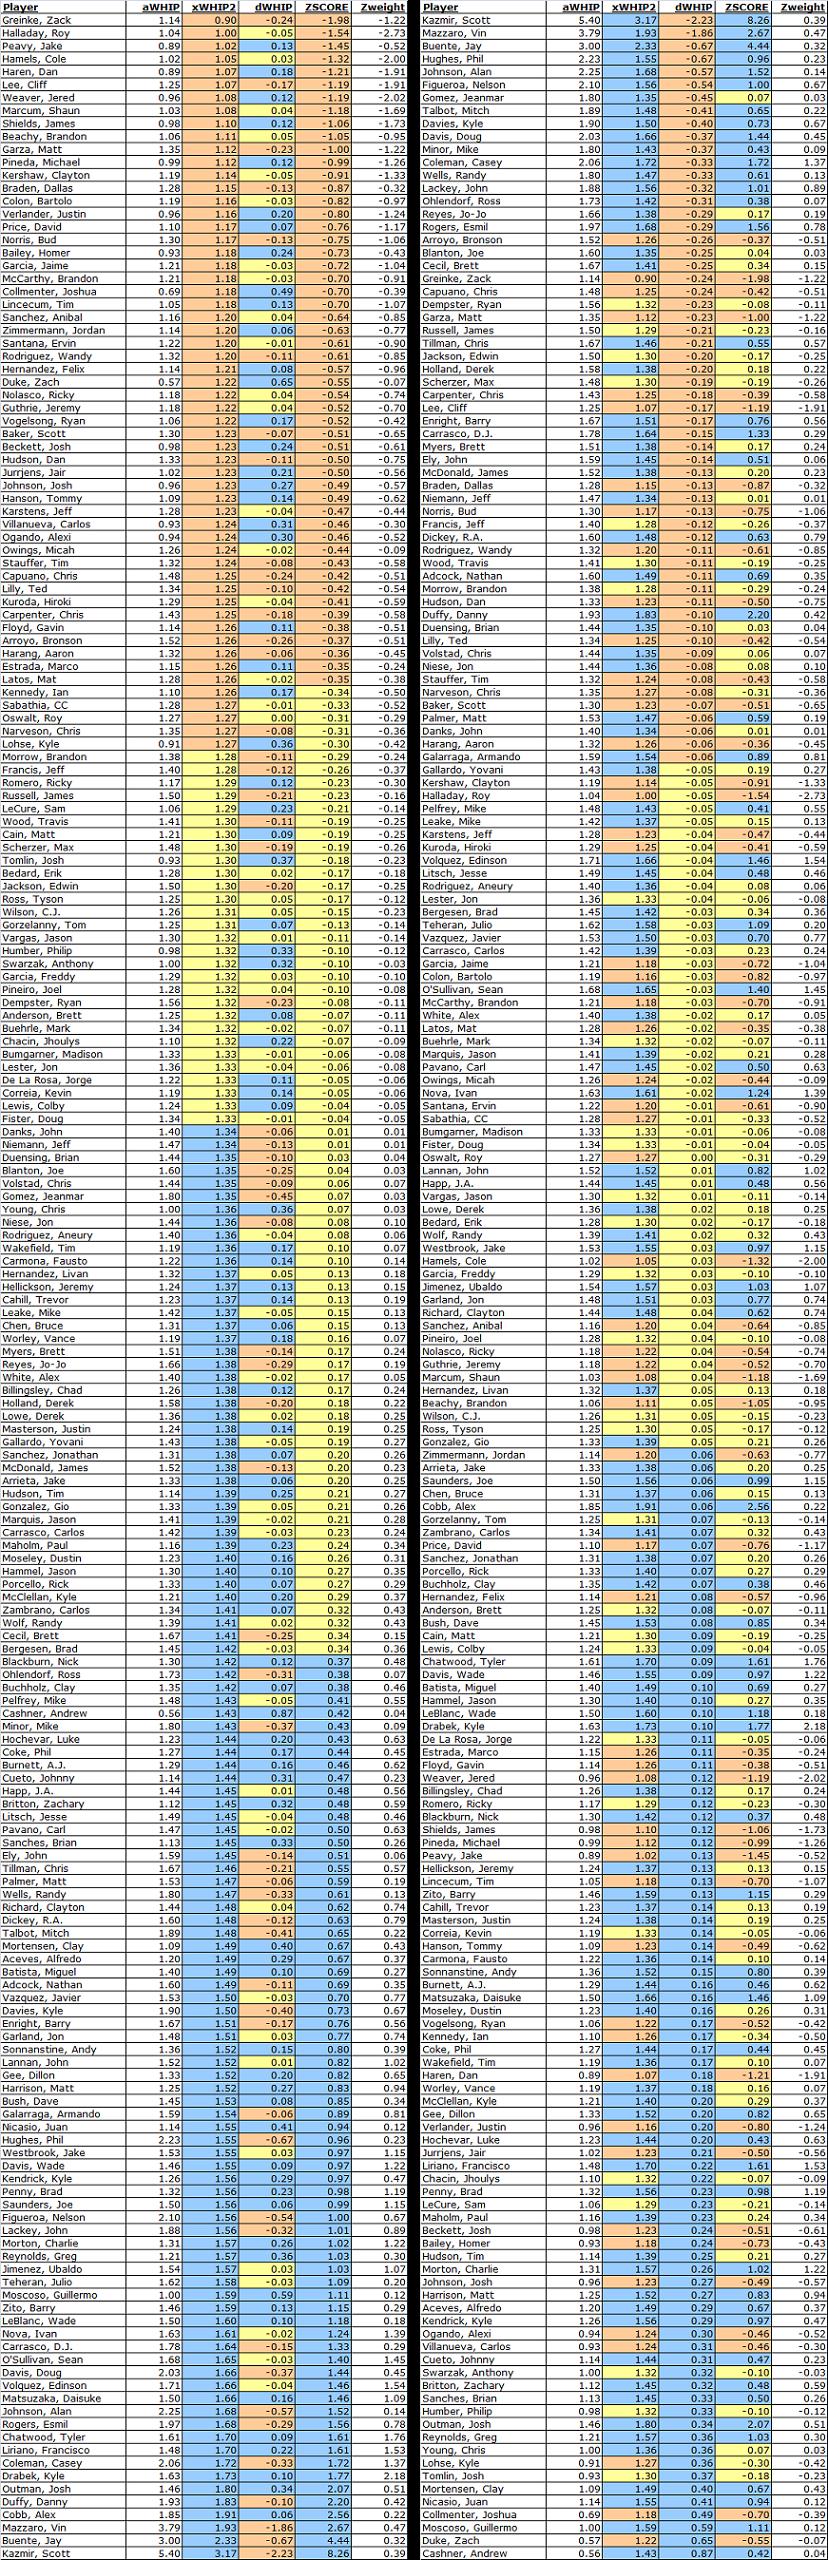
As always, leave the love/hate in the comments below.
Before reading this article, I encourage you to read my earlier xWHIP and eFIP; this is an extension of the data presented from it. All statistics are current through May 27.
Earlier this week, I presented an updated form of my xWHIP Calculator, which, with the power of normalization, calculates a pitcher's expected hits and expected innings based on his batted ball profile. In raw form, I presented various data points for both xWHIP and eFIP. While useful, such absolutes can be hard to interpret. What does a 1.16 xWHIP mean in isolation? Particularly with the low variance in WHIP in baseball (the range tends to be largely between 1.10 and 1.50), small differences in WHIP can make a larger difference than you might think.
To address these problems, I have calculated each player's xWHIP Z-Score to give some sense of relativity. Because we are dealing with pitchers, where lower is better, I calculated the data so that the lowest Z-Scores equate the best impact players, while higher Z-Scores indicate the worst players with the biggest impact. I also tabulated a column of weighted Z-Scores scaled to expected innings pitched through May 27. This will give you some sense of which players should, in theory, have had the biggest impact on WHIP through the first two months of the season.
Because this column is weighted based on expected innings to date, which may vary in the future based on past playing time, it should not necessarily be consulted in evaluating a player's prospects (e.g., Zack Greinke has the highest Z-Score at -1.98, but only a -1.22 weighted score due to his limited number of relative starts to begin the season). For future value, you should consult the player's unweighted Z-Score, which should be scaled based on relative expected future innings. For example, if pitcher A is expected to pitch 20 percent more innings than the average full-time starter for the rest of the season, his Z-Score should be adjusted accordingly.
To make the data easier to interpret, particularly because I am using Z-Scores in lieu of an index (this was done because of pitcher clustering; the Z-Score calculations give a better sense of impact and relativity for xWHIP), I color-coordinated the data below.
Orange cells mean that the pitcher is in the upper echelon of the relevant column. For xWHIP, this means the pitcher has an xWHIP below 1.27. For dWHIP (the difference between actual WHIP and xWHIP), this means that the pitcher's xWHIP is at least 0.05 points lower than his actual WHIP to date. For Z-Scores, it means the pitcher has an xWHIP Z-Score of -0.35 or lower. These are likely pitchers to target for acquisition, particularly if one or more of his xWHIP, dWHIP, or Z-Score is colored orange.
Blue cells mean that the pitcher is in the lower tier of the relevant column. For xWHIP, this means the pitcher has an xWHIP of or above 1.34. For dWHIP, this means that the pitcher's xWHIP is at least 0.05 points higher than his actual WHIP to date. For Z-Scores, it means the pitcher has a Z-Score of +0.35 or above. These are likely pitchers to avoid or trade, particularly if one or more of his xWHIP, dWHIP, or Z-Score is colored blue.
Yellow cells are "neutral." These are players who are unlikely to have any significant impact on your team's future WHIP, for better or worse. The xWHIP threshold for neutrality is 1.27 to 1.33. I chose 1.27 as the lower end of the xWHIP threshold, despite the fact that the league average xWHIP is 1.33, because the sample of fantasy players in use is a subset of the starting pitching population. The worst pitchers in the league are unlikely to be on a fantasy roster, and at the same time are likely to post the highest WHIPs. In my preseason E.Y.E.S. post about how to calculate auction values, I tabulated the league average fantasy player's WHIP at 1.265. Because starters tend to have a higher WHIPs than relievers on average (expected mean starter WHIP was 1.30), I am using 1.27 as the lower bound of neutrality.
That all noted, here is a visually organized presentation of the data. The left set of data is organized by xWHIP, while the right set of data is organized by dWHIP (you'll need to click the image to enlarge it):
As always, leave the love/hate in the comments below.
xWHIP and eFIP
The following comes from my latest article on The Hardball Times. All statistics are current through May 27, 2011.
Sabermetricians have shown that once the ball is out of the hands of the pitcher, the pitcher has very little control over the outcome of the ball put into play.
DIPS theory tells us that a pitcher controls a few things about the outcome of an at-bat, each to a variable degree. The pitcher has the most control over the elements of the game that only involve himself, and omit others. A pitcher is in almost absolute control over the general location of his pitch. There are some marginal or unpredictable variants such as temperature, weather, wind speed and wind direction that factor into pitch location, but a pitcher who does not hit his spots can generally only blame himself. He either gripped the ball incorrectly, released it too late, did not properly adjust his throw for weather condition, "has the jitters," just can't pitch, etc. A pitcher likewise almost completely (though less completely than location) controls intentional walks, which essentially eliminate the batter from the equation of the outcome. Though players like Miguel Cabrera and Jeff Francouer come to mind as the rare player who interferes with the pitcher's attempt to intentionally walk them, it is generally true that if a pitcher wants to intentionally walk a batter, it will happen.
Once the batter comes into the equation, the pitcher loses his control over the outcome. Once the pitch is released from his hands, he has done all he can do. It is then in the batter's hand as to whether contact is made, where on the ball the contact is made, how hard the ball is hit, and whether or not it is pulled, amongst various other variables. In this regard, a pitcher has some, but not total, control over unintentional walks and strikeouts. The pitcher tries to fool the batter, but the batter may or may not buy the bait. The fielders are irrelevant before the ball is put into play, so the outcome is largely dominated by an exercise in game theory between the batter and pitcher.
A pitcher also controls the tendency of the ball to be on the ground or in the air. As noted above, once the ball is released from the pitcher's hand, what happens to it is ultimately a question of what the batter does. A pitcher can throw the ball with heavy sink to induce ground balls, or throw it high in the zone to induce a popup, but the hitter, not the pitcher, ultimately controls the angle of trajectory, the force of contact, and the direction of the ball off the bat. Once contact is made, the ball is either put in play, in which case the pitcher's fielders have the ultimate control over what happens next, or the ball is foul, in which case the batter-pitcher game repeats, or the ball is a home run, over which the pitcher has some, but not ultimate, control. (This is the theory behind xFIP and using a normalized home run rate in lieu of the pitcher's actual home run rate as traditionally used in FIP.)
BABIP research by ball in play type out indicates that league fielding per batted ball type tends to be relatively stable. It tends to fluctuate annually, but only slightly and negligibly. For example, the expected hits rate on ground balls in play between 2004 and 2008 was .239. From 2008 to 2010, it was .236. So far this year, it is .238. The same is true for infield fly balls, line drives and outfield fly balls (though the latter two tend to fluctuate more, which is probably the result of scorer bias*). It is also true that line drive rate seems to remain relatively stable and out of pitcher control as well in the long run. Only a handful of pitchers have cumulative line drive rates that are not between 18 and 20 percent over the past five years, and most of those pitchers tend to be extreme batted-ball players. Even in the outlier, however, no pitcher has a line drive rate below 16 percent or above 22 percent. Noting this, you can probably say that Mat Latos' 9.2 percent line drive rate and Travis Woods' 24.5 percent line drive rate on the season are either the result of bad luck or funky scoring and that we should expect such to persist in the future.
*Note: scorer bias might make one skeptical of batted ball-based evaluation/prediction tools, but it is important to note that I am not, nor are most, preaching a black-and-white bible of truth with sabermetrics and sabermetric tools, but rather commenting upon the tendency of outcome or a rough baseline from which to make better, more informed decisions. Tools like tRA and the xWHIP Calculator are hardly perfect, but they lead to more informed analysis and decision-making.
From this research, I stood on the shoulders of men much smarter than myself and created the Expected WHIP (xWHIP) Calculator. (You can download the beta version for xWHIP3 by clicking here.) In case you are not familiar with how the xWHIP Calculator works, let me give you the quick rundown of how to use it and what it does. Refer to the picture of the beta of version 3.0 below (note: the 2008-2010 environment is loaded in the hits/outs created field; I do not have the runs created data for 2008-2010 to provide at this time).

The first and only manual step is data entry. Begin by entering data into the gray cells by using the player's page on Fangraphs. The xWHIP Calculator is calibrated to Baseball Info Solutions (BIS) batted ball data, and, to avoid unnecessary scorer bias through consistency, you need to enter BIS data, which is what is available on Fangraphs. You can also change the pink cells of "specialized data points," but will likely require information that is not publicly available to properly modify such. Hence, you should probably leave them untouched (well, unless you want to use a player's career home run per outfield flyball rate in lieu of the league average mark*).
*If you modify the HR/OFFB% cell, do not change the park factor cell, or you risk double counting.
Once you've entered the data, the rest is all automatic, courtesy of my tireless hours of work in creating the xWHIP Calculator. My xWHIP formula first adds up all the batted ball data, and then normalizes it based on a regressed line drive rate. I use 19 percent, or about the league average. Then, with my new "normalized" batted ball distribution, I multiply each ball in play form by its expected hits rate. This gives you expected hits. The calculator also also calculate expected home runs based on the normalized data.
Once a normalized batted ball distribution is created, the xWHIP Calculator also calculates an expected innings total (xIP). I calculate expected innings because actual innings pitched, like hits, is a function not only of player skill, but fielder interference/assistance and other statistical noise. A great or poor play is the difference between an extra batter faced and the end of the inning*. Expected innings is calculated by multiplying events by expected outs created by event. For example, a ground ball put in to play tends to result in 0.808 outs per occurrence. Caught stealing and pick off rates are something that varies by catcher and pitcher, but calculating such to be effectively utilized is something that I am not properly equipped to do. Hence, I use a league-average rate of .02 outs created per base runner to account for expected pickoffs and players who might get caught stealing. This formula gives me expected outs, which I then divide by three.
*This is why K% is more stable, indicative and, as a predictive/evaluational tool, valuable than K/9.
Using expected hits, expected home runs, and expected innings, as well as the other calculated data, we get a few valuable output points from the xWHIP Calculator. The primary purpose of the calculator and its calculations is to give a pitcher's expected WHIP. xWHIP may not be important from a purely sabermetrics standpoint, but fantasy baseball players find it quite useful. xWHIP is calculated in three ways. First, xWHIP1 calculates a pitcher's expected WHIP using actual innings pitched. Second, xWHIP2 calculates a pitcher's expected WHIP using expected innings (xIP). Finally, quick xWHIP, or qxWHIP, calculates a player's expected WHIP based purely on a player's actual innings pitched, strikeout total, and WHIP. qxWHIP was created by Alex Hambrick, and the theory behind it is explained here.
The xWHIP Calculator also has a quick-and-dirty defensive adjustment for pitchers that converts a team's defensive results into an expected "hits saved" compared to the hypothetical "league-average defense" per inning. This defensive adjustment has severe limitations (defense is hardly uniform infield-to-outfield, or player-to-player), and is optional, but it gives some sense of how a team's overall defense can be roughly expected to affect a player's "true talent" line.
In addition to xWHIP, however, the new versions of my xWHIP Calculator also tabulate two mainstream ERA estimators using normalized data. The first ERA estimator is eFIP, which is based on xFIP. xFIP is traditionally calculated by subtracting two times a pitcher's strikeout total by the sum of three times a pitcher's walk total plus 13 times .105 times that player's flyball total, all divided by innings pitched. The resulting figure is then added to some constant, usually 3.2, to scale xFIP to look like ERA. xFIP tends to be my ERA estimator of choice, but I have several problems with the popular version of the formula. First, it uses a pitcher's flyball total to calculate expected home runs. Flyball total is a composite of outfield fly balls and infield fly balls. As popups can never be home runs, it is silly to include them. In addition, home-run-per-outfield-fly-ball rates tend to be more stable over the long term than home-run-per-fly-ball rates.
Second, and perhaps this is offset by including popups in the traditional expected home run formula, xFIP does not account for line-drive home runs. Line-drive home runs are few and far between, but they do occur a few times per 100 hits that are scored as line drives.
Third, xFIP is tabulated irrespective of expected flyball or outfield flyball rate. Pitchers, as noted above, do not seem to have much control over line-drive rate. If a pitcher, particularly in smaller samples (which give you less valuable data outcomes), has an atypically low or high line-drive rate, then a pitcher's xFIP is skewed accordingly. The difference is, at most, a couple of home runs, but, like my infield flyball grudge with traditional xFIP, why use it if you don't have to?
Fourth, xFIP does not account for park factors. Each of the 30 major league parks has different park dimensions that uniquely affect home run totals. Petco and Busch Stadium affect pitcher's home runs allowed totals radically different than do the parks of Chicago. Players only play about 50 percent of their games at home, so you need to modify park factors accordingly, but the difference in expected ERA between Busch Stadium and Coors Field is substantial enough that it requires accounting, though that causes the xFIP formula to further sacrifice simplicity.
xFIP is a nice formula because it is simple and easy to calculate. Normally, accounting for my gripes would sacrifice much of xFIP's simplicity appeal. However, given all the calculations the xWHIP Calculator makes, calculating a modified expected FIP to correct for my gripes is simple. I term this modified xFIP formula "eFIP."
In addition to eFIP, the newest versions of the xWHIP Calculator will also calculated batted ball normalized versions of tRA or tERA, which I have termed "EXTRA." EXTRA is calculated the exact same way as tRA, but it uses the pitcher's normalized, not actual, batted ball data as the inputs.
Now that you know the parameters, let's look at some of the major league's leaders and losers in xWHIP, eFIP, and EXTRA using 2011's runs environment and statistics through May 27, 2011. You can download the data file by clicking here.
Before reviewing the data, take note of the following. First, the following calculations use major league outs/runs/hits numbers, not league-specific numbers, so American League pitchers will tend to fare worse than these numbers, while National League hitters will tend to perform better. Second, changes in a player's strikeout (xWHIP2) or walk rate (xWHIP1, xWHIP2) would have an appreciable effect on a pitcher's expected WHIP. Third, while only starting pitchers (pitchers with at least one game started) are included in my data file, with the exception of Zack Greinke, only starting pitchers with 30 or more expected innings are included in my leaderboard (136 starting pitchers qualify). Fourth, I am calculating WHIP with unintentional walks (BB-IBB+HBP, or uBB); uBB better evaluates a pitcher's control and expected baserunners. Finally, the league average xWHIP and eFIP are 1.32 and 4.00, respectively. The actual current major league average WHIP and FIP are 1.30 and 3.95, respectively.
First, the WHIP under-performers to date (calculated using "actual WHIP" (see above) minus the mean of a pitcher's xWHIP1 and xWHIP2):
Much of this leaderboard is populated with under-inspiring pitchers who, while unlikely, have pitched pretty poorly this year and are hardly worth a spot on your bench. Case in point: the injured John Lackey and "immutable" Kyle Davies. A few names do stand out, however. I think the ship sailed on Ryan Dempster (whose numbers are infinitely better if you omit his 0.1 inning pitched disaster at Arizona) after his 11-strikeout performance on May 13, but maybe some owner has not been paying close enough attention this past month (e.g., people in college). We all know Cliff Lee and Matt Garza have had their share of bad luck this year, but what about Chris Carpenter and Zack Greinke? Greinke's performance to date puts him in company with the top three guys in the league, but his 5.79 ERA has been ugly. If any owner is having second thoughts about the Royals ex-Ace, or is willing to deal him at market value, I'd strongly considering biting. And what about Bud Norris? I wrote about him last week, but his ownership rate is still below 50 percent (it actually went down a notch). I think a lot of people are overlooking just how good Norris has been this year. Jeff Francis and Travis Wood are a pair of pitchers who could help you in other categories without hurting your future WHIP.
Next, the WHIP over-performers to date (calculated using "actual WHIP" (see above) minus the mean of a pitcher's xWHIP1 and xWHIP2):
Here we find a lot of players with BABIP-deflated ERAs who are on the Atkins diet when it comes to strikeouts: Kyle Lohse and Zach Britton's combined strikeouts per nine rate (9.81) is equal to that of Bud Norris. Most of these "trailers" tend to be groundball pitchers because groundballs, while having a lower expected runs outcome per event, have a higher hits-resulting rate. A year of xWHIP has taught me that ERA and WHIP tend to be inversely related to groundball and flyball rates. Alexei Ogando throws hard, but can you really trust a flyball pitcher (64.5 percent AO%) in Texas (inflates home runs by 10 percent)? Ogando's SwStr% (8.9 percent) indicates he is capable of slightly better than league-average strikeout totals. As you might notice not all players on this board are "bad" or have "bad" expected WHIPs (e.g., Josh Beckett). This is only a tool to help figuring out who has been under/over-performing, and an under-performer may very well be worth keeping.
Then we have the pitchers who are secretly better than their listed FIP.
If there is any pitcher to avoid on this list, it's Edinson Volquez. I took a lot of flack being a vocal Volquez hater this offseason, and while it's only been 51 innings, I really want to say "I told you so" about how bad his control was going to burn him this year. Volquez has a 4.16 xFIP, so a lot of people might be tempted to buy, but even if you tinker with his batted ball distribution a bit, his expected FIP is putrid. A 4.50 FIP would be "average" by standards two or three years ago, but in the new era of the pitcher, it's trade-or-cut material. Ryan Dempster's a name on this list I really like, but, as noted above, the ship has probably sailed on him by now. Same goes with Erik Bedard, who has been lights out over his past five or so turns. And what about Bartolo Colon? Is he the real deal after injecting cheeseburgers from his belly into his elbow? No matter which you choose, all the metrics seem to check out (3.77 ERA, 1.20 WHIP, 3.61 FIP, 2.90 xFIP, 3.86 eFIP, 1.20 WHIP, 1.28 xWHIP), but something does not smell right. A 5.9 percent SwStr% ties for his second-lowest mark since 2002 and is well below his post-2002 average of 7.6 percent, but his strikeout rate (23.6 percent) is a career second-best at age 38? I'd use the "it checks out" line to hedge your risk.
What's up with Jeff Karstens? He's been good on the surface (3.57 ERA, 1.28), but regular FIP says look out (4.70). Karsten's improved strikeout rate (18.9 percent this season, 12.2 percent career) makes sense if you look at batters' swing-and-miss rate against him (9.0 percent this year, 7.1 percent career, 8.4 percent major league average), but what is causing it? It's not his velocity (88.4 MPH fastball this year, 88.5 career) or pitch usage (none of his four usage rates varies by more than a few percent points this season). His change-up has been wicked awesome, but both his fastball and slider (thrown almost a combined three-fourths of the time) have fared poorly both this year and for his career. Tread at your own caution.
Chris Capuano, on the other hand, has been secretly good for the Mets, even if the results do not say so. His ERA (4.94) and WHIP (1.45) have been atrocious, but his peripherals (3.86 eFIP, 1.28 xWHIP, 7.74 K/9, 19.4 percent K%) say this waiver wire fodder (2 percent Yahoo ownership) might be worth a careful look.
And the guys whose FIPs are not telling the whole story. Keep in mind that in the second "year of the pitcher," ERAs are not what they used to seem.
My mother always told me to never trust Brandon Morrow. As I noted last week, you're better off selling him at cost to another saber-friendly owner and investing the funds elsewhere. Jordan Zimmerman is much better than he's been or his presence here indicates, and I would sit tight with him. Is Justin Masterson finally putting it all together as a post-hype sleeper? 3.61 xFIP versus lefties (165 batters) and 3.26 xFIP versus righties (110 batters). Sorry Orioles fans clinging to old Bedard jerseys; Chris Tillman is not the stud or the sleeper we thought he was. Ditto on Brad Bergesen, who I once had a fantasy man crush on several years back. After 10 years, you should not be fooled by Jason Marquis. He tends to start things off well with new teams, but it always ends badly. Has Doug Fister been ol' reliable for you thus far? Don't expect it to persist, as he's more likely to take his hand and slap your fantasy team with it in the future. I've shaken off my preseason (Phil) Coke addiction, and what of former top Twins draftee Phil Humber? 2.85 ERA, 3.77 FIP looks nice for something you plucked off the waiver wire for a stream that never seemed to end in a drop, but lackluster strikeouts plus league-average WHIP plus poor ERA prospects equal trade toss in to get a better deal done. Finally, Livan Hernandez is not even worth mentioning.
Next time out (this upcoming Monday), we'll look at EXTRA, actual ERA and actual tRA to date. Until then, as always, leave your love/hate in the comments below.
Sabermetricians have shown that once the ball is out of the hands of the pitcher, the pitcher has very little control over the outcome of the ball put into play.
DIPS theory tells us that a pitcher controls a few things about the outcome of an at-bat, each to a variable degree. The pitcher has the most control over the elements of the game that only involve himself, and omit others. A pitcher is in almost absolute control over the general location of his pitch. There are some marginal or unpredictable variants such as temperature, weather, wind speed and wind direction that factor into pitch location, but a pitcher who does not hit his spots can generally only blame himself. He either gripped the ball incorrectly, released it too late, did not properly adjust his throw for weather condition, "has the jitters," just can't pitch, etc. A pitcher likewise almost completely (though less completely than location) controls intentional walks, which essentially eliminate the batter from the equation of the outcome. Though players like Miguel Cabrera and Jeff Francouer come to mind as the rare player who interferes with the pitcher's attempt to intentionally walk them, it is generally true that if a pitcher wants to intentionally walk a batter, it will happen.
Once the batter comes into the equation, the pitcher loses his control over the outcome. Once the pitch is released from his hands, he has done all he can do. It is then in the batter's hand as to whether contact is made, where on the ball the contact is made, how hard the ball is hit, and whether or not it is pulled, amongst various other variables. In this regard, a pitcher has some, but not total, control over unintentional walks and strikeouts. The pitcher tries to fool the batter, but the batter may or may not buy the bait. The fielders are irrelevant before the ball is put into play, so the outcome is largely dominated by an exercise in game theory between the batter and pitcher.
A pitcher also controls the tendency of the ball to be on the ground or in the air. As noted above, once the ball is released from the pitcher's hand, what happens to it is ultimately a question of what the batter does. A pitcher can throw the ball with heavy sink to induce ground balls, or throw it high in the zone to induce a popup, but the hitter, not the pitcher, ultimately controls the angle of trajectory, the force of contact, and the direction of the ball off the bat. Once contact is made, the ball is either put in play, in which case the pitcher's fielders have the ultimate control over what happens next, or the ball is foul, in which case the batter-pitcher game repeats, or the ball is a home run, over which the pitcher has some, but not ultimate, control. (This is the theory behind xFIP and using a normalized home run rate in lieu of the pitcher's actual home run rate as traditionally used in FIP.)
BABIP research by ball in play type out indicates that league fielding per batted ball type tends to be relatively stable. It tends to fluctuate annually, but only slightly and negligibly. For example, the expected hits rate on ground balls in play between 2004 and 2008 was .239. From 2008 to 2010, it was .236. So far this year, it is .238. The same is true for infield fly balls, line drives and outfield fly balls (though the latter two tend to fluctuate more, which is probably the result of scorer bias*). It is also true that line drive rate seems to remain relatively stable and out of pitcher control as well in the long run. Only a handful of pitchers have cumulative line drive rates that are not between 18 and 20 percent over the past five years, and most of those pitchers tend to be extreme batted-ball players. Even in the outlier, however, no pitcher has a line drive rate below 16 percent or above 22 percent. Noting this, you can probably say that Mat Latos' 9.2 percent line drive rate and Travis Woods' 24.5 percent line drive rate on the season are either the result of bad luck or funky scoring and that we should expect such to persist in the future.
*Note: scorer bias might make one skeptical of batted ball-based evaluation/prediction tools, but it is important to note that I am not, nor are most, preaching a black-and-white bible of truth with sabermetrics and sabermetric tools, but rather commenting upon the tendency of outcome or a rough baseline from which to make better, more informed decisions. Tools like tRA and the xWHIP Calculator are hardly perfect, but they lead to more informed analysis and decision-making.
From this research, I stood on the shoulders of men much smarter than myself and created the Expected WHIP (xWHIP) Calculator. (You can download the beta version for xWHIP3 by clicking here.) In case you are not familiar with how the xWHIP Calculator works, let me give you the quick rundown of how to use it and what it does. Refer to the picture of the beta of version 3.0 below (note: the 2008-2010 environment is loaded in the hits/outs created field; I do not have the runs created data for 2008-2010 to provide at this time).

The first and only manual step is data entry. Begin by entering data into the gray cells by using the player's page on Fangraphs. The xWHIP Calculator is calibrated to Baseball Info Solutions (BIS) batted ball data, and, to avoid unnecessary scorer bias through consistency, you need to enter BIS data, which is what is available on Fangraphs. You can also change the pink cells of "specialized data points," but will likely require information that is not publicly available to properly modify such. Hence, you should probably leave them untouched (well, unless you want to use a player's career home run per outfield flyball rate in lieu of the league average mark*).
*If you modify the HR/OFFB% cell, do not change the park factor cell, or you risk double counting.
Once you've entered the data, the rest is all automatic, courtesy of my tireless hours of work in creating the xWHIP Calculator. My xWHIP formula first adds up all the batted ball data, and then normalizes it based on a regressed line drive rate. I use 19 percent, or about the league average. Then, with my new "normalized" batted ball distribution, I multiply each ball in play form by its expected hits rate. This gives you expected hits. The calculator also also calculate expected home runs based on the normalized data.
Once a normalized batted ball distribution is created, the xWHIP Calculator also calculates an expected innings total (xIP). I calculate expected innings because actual innings pitched, like hits, is a function not only of player skill, but fielder interference/assistance and other statistical noise. A great or poor play is the difference between an extra batter faced and the end of the inning*. Expected innings is calculated by multiplying events by expected outs created by event. For example, a ground ball put in to play tends to result in 0.808 outs per occurrence. Caught stealing and pick off rates are something that varies by catcher and pitcher, but calculating such to be effectively utilized is something that I am not properly equipped to do. Hence, I use a league-average rate of .02 outs created per base runner to account for expected pickoffs and players who might get caught stealing. This formula gives me expected outs, which I then divide by three.
*This is why K% is more stable, indicative and, as a predictive/evaluational tool, valuable than K/9.
Using expected hits, expected home runs, and expected innings, as well as the other calculated data, we get a few valuable output points from the xWHIP Calculator. The primary purpose of the calculator and its calculations is to give a pitcher's expected WHIP. xWHIP may not be important from a purely sabermetrics standpoint, but fantasy baseball players find it quite useful. xWHIP is calculated in three ways. First, xWHIP1 calculates a pitcher's expected WHIP using actual innings pitched. Second, xWHIP2 calculates a pitcher's expected WHIP using expected innings (xIP). Finally, quick xWHIP, or qxWHIP, calculates a player's expected WHIP based purely on a player's actual innings pitched, strikeout total, and WHIP. qxWHIP was created by Alex Hambrick, and the theory behind it is explained here.
The xWHIP Calculator also has a quick-and-dirty defensive adjustment for pitchers that converts a team's defensive results into an expected "hits saved" compared to the hypothetical "league-average defense" per inning. This defensive adjustment has severe limitations (defense is hardly uniform infield-to-outfield, or player-to-player), and is optional, but it gives some sense of how a team's overall defense can be roughly expected to affect a player's "true talent" line.
In addition to xWHIP, however, the new versions of my xWHIP Calculator also tabulate two mainstream ERA estimators using normalized data. The first ERA estimator is eFIP, which is based on xFIP. xFIP is traditionally calculated by subtracting two times a pitcher's strikeout total by the sum of three times a pitcher's walk total plus 13 times .105 times that player's flyball total, all divided by innings pitched. The resulting figure is then added to some constant, usually 3.2, to scale xFIP to look like ERA. xFIP tends to be my ERA estimator of choice, but I have several problems with the popular version of the formula. First, it uses a pitcher's flyball total to calculate expected home runs. Flyball total is a composite of outfield fly balls and infield fly balls. As popups can never be home runs, it is silly to include them. In addition, home-run-per-outfield-fly-ball rates tend to be more stable over the long term than home-run-per-fly-ball rates.
Second, and perhaps this is offset by including popups in the traditional expected home run formula, xFIP does not account for line-drive home runs. Line-drive home runs are few and far between, but they do occur a few times per 100 hits that are scored as line drives.
Third, xFIP is tabulated irrespective of expected flyball or outfield flyball rate. Pitchers, as noted above, do not seem to have much control over line-drive rate. If a pitcher, particularly in smaller samples (which give you less valuable data outcomes), has an atypically low or high line-drive rate, then a pitcher's xFIP is skewed accordingly. The difference is, at most, a couple of home runs, but, like my infield flyball grudge with traditional xFIP, why use it if you don't have to?
Fourth, xFIP does not account for park factors. Each of the 30 major league parks has different park dimensions that uniquely affect home run totals. Petco and Busch Stadium affect pitcher's home runs allowed totals radically different than do the parks of Chicago. Players only play about 50 percent of their games at home, so you need to modify park factors accordingly, but the difference in expected ERA between Busch Stadium and Coors Field is substantial enough that it requires accounting, though that causes the xFIP formula to further sacrifice simplicity.
xFIP is a nice formula because it is simple and easy to calculate. Normally, accounting for my gripes would sacrifice much of xFIP's simplicity appeal. However, given all the calculations the xWHIP Calculator makes, calculating a modified expected FIP to correct for my gripes is simple. I term this modified xFIP formula "eFIP."
In addition to eFIP, the newest versions of the xWHIP Calculator will also calculated batted ball normalized versions of tRA or tERA, which I have termed "EXTRA." EXTRA is calculated the exact same way as tRA, but it uses the pitcher's normalized, not actual, batted ball data as the inputs.
Now that you know the parameters, let's look at some of the major league's leaders and losers in xWHIP, eFIP, and EXTRA using 2011's runs environment and statistics through May 27, 2011. You can download the data file by clicking here.
Before reviewing the data, take note of the following. First, the following calculations use major league outs/runs/hits numbers, not league-specific numbers, so American League pitchers will tend to fare worse than these numbers, while National League hitters will tend to perform better. Second, changes in a player's strikeout (xWHIP2) or walk rate (xWHIP1, xWHIP2) would have an appreciable effect on a pitcher's expected WHIP. Third, while only starting pitchers (pitchers with at least one game started) are included in my data file, with the exception of Zack Greinke, only starting pitchers with 30 or more expected innings are included in my leaderboard (136 starting pitchers qualify). Fourth, I am calculating WHIP with unintentional walks (BB-IBB+HBP, or uBB); uBB better evaluates a pitcher's control and expected baserunners. Finally, the league average xWHIP and eFIP are 1.32 and 4.00, respectively. The actual current major league average WHIP and FIP are 1.30 and 3.95, respectively.
First, the WHIP under-performers to date (calculated using "actual WHIP" (see above) minus the mean of a pitcher's xWHIP1 and xWHIP2):
Name                   xIP        aWHIP     xWHIP     dWHIP
Davies, Kyle           44.54      1.90      1.57      0.34
Lackey, John           42.57      1.88      1.63      0.25
Reyes, Jo-Jo           55.06      1.66      1.42      0.24
Arroyo, Bronson        67.25      1.52      1.30      0.21
Greinke, Zack          29.99      1.14      0.93      0.21
Capuano, Chris         57.87      1.48      1.28      0.20
Dempster, Ryan         66.79      1.56      1.36      0.19
Garza, Matt            59.54      1.35      1.16      0.19
Holland, Derek         61.03      1.58      1.39      0.18
Jackson, Edwin         70.82      1.50      1.33      0.17
Tillman, Chris         50.41      1.67      1.50      0.17
Scherzer, Max          67.28      1.48      1.32      0.17
Carpenter, Chris       73.60      1.43      1.28      0.15
Lee, Cliff             78.18      1.25      1.10      0.15
Myers, Brett           69.78      1.51      1.39      0.13
McDonald, James        54.30      1.52      1.40      0.12
Norris, Bud            68.42      1.30      1.18      0.11
Dickey, R.A.           61.18      1.60      1.49      0.11
Francis, Jeff          69.59      1.40      1.30      0.10
Wood, Travis           62.79      1.41      1.31      0.10
Hudson, Dan            72.45      1.33      1.23      0.10
Rodriguez, Wandy       67.84      1.32      1.22      0.10
Lilly, Ted             63.55      1.34      1.25      0.09
Duensing, Brian        54.92      1.44      1.36      0.09
Morrow, Brandon        40.47      1.38      1.30      0.08
Baker, Scott           61.52      1.30      1.22      0.07
Stauffer, Tim          65.87      1.32      1.25      0.07
Niese, Jon             62.10      1.44      1.38      0.06
Volstad, Chris         52.02      1.44      1.38      0.06
Danks, John            66.59      1.40      1.34      0.06
Harang, Aaron          61.74      1.32      1.26      0.06
Narveson, Chris        57.44      1.35      1.29      0.06
Much of this leaderboard is populated with under-inspiring pitchers who, while unlikely, have pitched pretty poorly this year and are hardly worth a spot on your bench. Case in point: the injured John Lackey and "immutable" Kyle Davies. A few names do stand out, however. I think the ship sailed on Ryan Dempster (whose numbers are infinitely better if you omit his 0.1 inning pitched disaster at Arizona) after his 11-strikeout performance on May 13, but maybe some owner has not been paying close enough attention this past month (e.g., people in college). We all know Cliff Lee and Matt Garza have had their share of bad luck this year, but what about Chris Carpenter and Zack Greinke? Greinke's performance to date puts him in company with the top three guys in the league, but his 5.79 ERA has been ugly. If any owner is having second thoughts about the Royals ex-Ace, or is willing to deal him at market value, I'd strongly considering biting. And what about Bud Norris? I wrote about him last week, but his ownership rate is still below 50 percent (it actually went down a notch). I think a lot of people are overlooking just how good Norris has been this year. Jeff Francis and Travis Wood are a pair of pitchers who could help you in other categories without hurting your future WHIP.
Next, the WHIP over-performers to date (calculated using "actual WHIP" (see above) minus the mean of a pitcher's xWHIP1 and xWHIP2):
Name                   xIP        aWHIP     xWHIP     dWHIP
Tomlin, Josh           60.26      0.93      1.24     -0.32
Lohse, Kyle            67.89      0.91      1.22     -0.30
Humber, Philip         56.67      0.98      1.28     -0.30
Britton, Zachary       59.14      1.12      1.38     -0.26
Ogando, Alexi          54.57      0.94      1.18     -0.25
Johnson, Josh          56.03      0.96      1.19     -0.23
Hudson, Tim            62.97      1.14      1.35     -0.22
Morton, Charlie        58.11      1.31      1.52     -0.21
Harrison, Matt         55.43      1.25      1.46     -0.20
Chacin, Jhoulys        64.78      1.10      1.30     -0.20
Maholm, Paul           66.89      1.16      1.36     -0.20
Beckett, Josh          58.97      0.98      1.18     -0.19
Penny, Brad            59.28      1.32      1.51     -0.19
Hochevar, Luke         70.45      1.23      1.41     -0.18
Liriano, Francisco     46.26      1.48      1.66     -0.18
Verlander, Justin      75.59      0.96      1.14     -0.17
Jurrjens, Jair         54.41      1.02      1.19     -0.17
McClellan, Kyle        61.16      1.21      1.38     -0.17
Haren, Dan             77.03      0.89      1.06     -0.16
Kennedy, Ian           71.84      1.10      1.24     -0.14
Coke, Phil             49.98      1.27      1.41     -0.14
Moseley, Dustin        57.56      1.23      1.37     -0.14
Burnett, A.J.          65.88      1.29      1.42     -0.14
Hanson, Tommy          62.63      1.09      1.22     -0.13
Carmona, Fausto        70.32      1.22      1.34     -0.13
Correia, Kevin         68.79      1.19      1.31     -0.12
Billingsley, Chad      67.93      1.26      1.37     -0.12
Cahill, Trevor         69.18      1.23      1.35     -0.11
Pineda, Michael        61.86      0.99      1.11     -0.11
Lincecum, Tim          74.38      1.05      1.16     -0.11
Hellickson, Jeremy     55.45      1.24      1.35     -0.11
Weaver, Jered          82.98      0.96      1.06     -0.10
Here we find a lot of players with BABIP-deflated ERAs who are on the Atkins diet when it comes to strikeouts: Kyle Lohse and Zach Britton's combined strikeouts per nine rate (9.81) is equal to that of Bud Norris. Most of these "trailers" tend to be groundball pitchers because groundballs, while having a lower expected runs outcome per event, have a higher hits-resulting rate. A year of xWHIP has taught me that ERA and WHIP tend to be inversely related to groundball and flyball rates. Alexei Ogando throws hard, but can you really trust a flyball pitcher (64.5 percent AO%) in Texas (inflates home runs by 10 percent)? Ogando's SwStr% (8.9 percent) indicates he is capable of slightly better than league-average strikeout totals. As you might notice not all players on this board are "bad" or have "bad" expected WHIPs (e.g., Josh Beckett). This is only a tool to help figuring out who has been under/over-performing, and an under-performer may very well be worth keeping.
Then we have the pitchers who are secretly better than their listed FIP.
Name               xIP      aFIP    EXFIP   dFIP
Karstens, Jeff     45.60    4.92    3.57    1.35
Volquez, Edinson   51.36    5.77    4.50    1.27
Arroyo, Bronson    67.25    5.48    4.33    1.15
Gorzelanny, Tom    52.31    5.28    4.14    1.14
Hochevar, Luke     70.45    5.46    4.35    1.11
Dempster, Ryan     66.79    4.80    3.78    1.03
Myers, Brett       69.78    5.44    4.49    0.95
Greinke, Zack      29.99    3.06    2.18    0.88
McDonald, James    54.30    5.11    4.29    0.82
Lester, Jon        68.85    4.25    3.48    0.77
Capuano, Chris     57.87    4.61    3.86    0.75
Bedard, Erik       51.52    4.32    3.68    0.65
O'Sullivan, Sean   50.48    6.26    5.61    0.64
Lewis, Colby       64.90    5.26    4.62    0.64
Latos, Mat         53.83    4.35    3.80    0.55
Buchholz, Clay     58.87    4.77    4.25    0.52
Romero, Ricky      63.02    3.98    3.48    0.50
Baker, Scott       61.52    4.19    3.70    0.49
Pelfrey, Mike      64.67    5.07    4.59    0.48
Carmona, Fausto    70.32    4.29    3.82    0.47
Colon, Bartolo     57.80    3.79    3.32    0.47
Blackburn, Nick    62.39    4.65    4.19    0.47
Norris, Bud        68.42    3.75    3.30    0.45
Chen, Bruce        41.62    5.12    4.68    0.45
Arrieta, Jake      60.54    4.66    4.23    0.43
Chacin, Jhoulys    64.78    3.96    3.56    0.40
Scherzer, Max      67.28    4.36    3.98    0.39
Lilly, Ted         63.55    4.67    4.28    0.39
Dickey, R.A.       61.18    4.75    4.37    0.38
Gallardo, Yovani   68.64    4.27    3.91    0.36
Litsch, Jesse      46.74    4.69    4.35    0.34
Kuroda, Hiroki     70.70    4.15    3.81    0.34
Rodriguez, Wandy   67.84    4.05    3.71    0.33
Liriano, Francis   46.26    5.44    5.11    0.33
Volstad, Chris     52.02    4.24    3.91    0.33
If there is any pitcher to avoid on this list, it's Edinson Volquez. I took a lot of flack being a vocal Volquez hater this offseason, and while it's only been 51 innings, I really want to say "I told you so" about how bad his control was going to burn him this year. Volquez has a 4.16 xFIP, so a lot of people might be tempted to buy, but even if you tinker with his batted ball distribution a bit, his expected FIP is putrid. A 4.50 FIP would be "average" by standards two or three years ago, but in the new era of the pitcher, it's trade-or-cut material. Ryan Dempster's a name on this list I really like, but, as noted above, the ship has probably sailed on him by now. Same goes with Erik Bedard, who has been lights out over his past five or so turns. And what about Bartolo Colon? Is he the real deal after injecting cheeseburgers from his belly into his elbow? No matter which you choose, all the metrics seem to check out (3.77 ERA, 1.20 WHIP, 3.61 FIP, 2.90 xFIP, 3.86 eFIP, 1.20 WHIP, 1.28 xWHIP), but something does not smell right. A 5.9 percent SwStr% ties for his second-lowest mark since 2002 and is well below his post-2002 average of 7.6 percent, but his strikeout rate (23.6 percent) is a career second-best at age 38? I'd use the "it checks out" line to hedge your risk.
What's up with Jeff Karstens? He's been good on the surface (3.57 ERA, 1.28), but regular FIP says look out (4.70). Karsten's improved strikeout rate (18.9 percent this season, 12.2 percent career) makes sense if you look at batters' swing-and-miss rate against him (9.0 percent this year, 7.1 percent career, 8.4 percent major league average), but what is causing it? It's not his velocity (88.4 MPH fastball this year, 88.5 career) or pitch usage (none of his four usage rates varies by more than a few percent points this season). His change-up has been wicked awesome, but both his fastball and slider (thrown almost a combined three-fourths of the time) have fared poorly both this year and for his career. Tread at your own caution.
Chris Capuano, on the other hand, has been secretly good for the Mets, even if the results do not say so. His ERA (4.94) and WHIP (1.45) have been atrocious, but his peripherals (3.86 eFIP, 1.28 xWHIP, 7.74 K/9, 19.4 percent K%) say this waiver wire fodder (2 percent Yahoo ownership) might be worth a careful look.
And the guys whose FIPs are not telling the whole story. Keep in mind that in the second "year of the pitcher," ERAs are not what they used to seem.
Name               xIP      aFIP    EXFIP  dFIP
Bergesen, Brad     51.38    3.90    5.15   -1.26
Morrow, Brandon    40.47    2.53    3.63   -1.09
Tillman, Chris     50.41    3.85    4.89   -1.04
McCarthy, Brando   62.85    2.67    3.60   -0.93
Jurrjens, Jair     54.41    2.97    3.85   -0.88
Coke, Phil         49.98    3.83    4.65   -0.81
Hudson, Dan        72.45    2.88    3.66   -0.78
Buehrle, Mark      72.50    3.82    4.59   -0.76
Zimmermann, Jord   60.00    2.98    3.73   -0.75
Sabathia, CC       77.83    2.99    3.70   -0.71
Fister, Doug       63.85    3.57    4.27   -0.70
Garza, Matt        59.54    2.01    2.71   -0.69
Lohse, Kyle        67.89    3.23    3.91   -0.68
Bumgarner, Madis   57.50    3.16    3.84   -0.67
Zambrano, Carlos   66.71    3.94    4.57   -0.62
Humber, Philip     56.67    3.77    4.35   -0.59
Hernandez, Livan   68.75    3.94    4.47   -0.53
Halladay, Roy      86.09    1.93    2.46   -0.53
Billingsley, Cha   67.93    3.29    3.82   -0.53
Johnson, Josh      56.03    2.72    3.24   -0.52
Masterson, Justi   64.33    3.23    3.72   -0.49
Marquis, Jason     63.53    3.80    4.27   -0.47
Weaver, Jered      82.98    2.74    3.21   -0.46
Oswalt, Roy        44.97    3.29    3.73   -0.44
Kennedy, Ian       71.84    3.41    3.84   -0.42
Beckett, Josh      58.97    3.03    3.45   -0.42
Pineda, Michael    61.86    2.84    3.25   -0.42
Morton, Charlie    58.11    3.91    4.29   -0.38
Reyes, Jo-Jo       55.06    4.25    4.61   -0.36
Maholm, Paul       66.89    3.60    3.96   -0.36
Chatwood, Tyler    53.24    5.09    5.45   -0.36
Nova, Ivan         54.62    4.61    4.96   -0.36
My mother always told me to never trust Brandon Morrow. As I noted last week, you're better off selling him at cost to another saber-friendly owner and investing the funds elsewhere. Jordan Zimmerman is much better than he's been or his presence here indicates, and I would sit tight with him. Is Justin Masterson finally putting it all together as a post-hype sleeper? 3.61 xFIP versus lefties (165 batters) and 3.26 xFIP versus righties (110 batters). Sorry Orioles fans clinging to old Bedard jerseys; Chris Tillman is not the stud or the sleeper we thought he was. Ditto on Brad Bergesen, who I once had a fantasy man crush on several years back. After 10 years, you should not be fooled by Jason Marquis. He tends to start things off well with new teams, but it always ends badly. Has Doug Fister been ol' reliable for you thus far? Don't expect it to persist, as he's more likely to take his hand and slap your fantasy team with it in the future. I've shaken off my preseason (Phil) Coke addiction, and what of former top Twins draftee Phil Humber? 2.85 ERA, 3.77 FIP looks nice for something you plucked off the waiver wire for a stream that never seemed to end in a drop, but lackluster strikeouts plus league-average WHIP plus poor ERA prospects equal trade toss in to get a better deal done. Finally, Livan Hernandez is not even worth mentioning.
Next time out (this upcoming Monday), we'll look at EXTRA, actual ERA and actual tRA to date. Until then, as always, leave your love/hate in the comments below.